AGI (NYSE:AGBK) Valuation Check After Recent 7.7% Share Price Move
AGI Inc Class A AGBK | 7.45 | -0.27% |
AGI stock: what the latest move means for investors
AGI (AGBK) gained 7.7% in the latest session, drawing attention to the Brazil based financial services provider and its cloud and AI enabled lending and insurance platform serving social security and payroll clients.
The 7.7% 1 day share price return lifts AGI to $11.00, while the year to date share price return of 2.3% suggests early momentum that investors may see as a shift in sentiment around its Brazil focused, AI enabled lending and insurance platform.
If this AI focused lender has caught your eye, it could be a good moment to see what else is moving in financial technology and credit, including 57 profitable AI stocks that aren't just burning cash.
With AGI trading at $11.00 and an intrinsic value estimate that sits close by, the key question is whether the market is already factoring in its AI powered Brazil growth story, or if there is still upside being overlooked.
Price-to-earnings of 9x: is it justified?
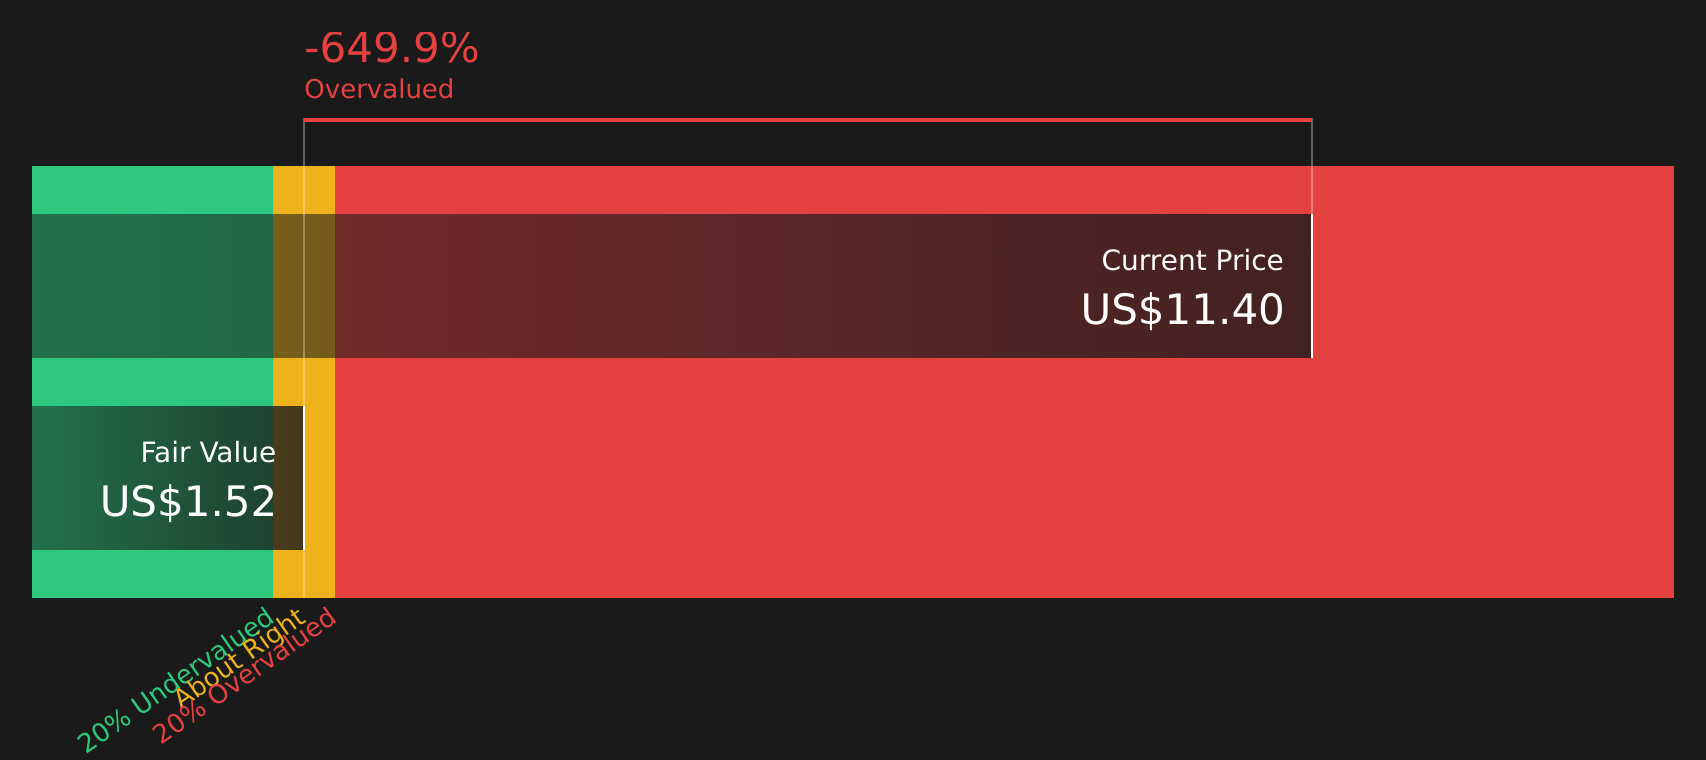
AGI currently trades on a P/E of 9x, while our DCF estimate for future cash flows sits at $1.99 per share versus the $11.00 last close.
The P/E ratio compares the share price to the company’s earnings per share, so at 9x the market is paying nine times AGI’s current earnings.
For a Brazil focused bank using an AI driven, cloud based model, a 9x P/E sits below the US market and US banks averages in the data provided. This is the case even though AGI’s earnings grew 45.8% over the past year and are described as high quality. That mix of a lower multiple with strong recent earnings growth suggests investors are pricing AGI more cautiously than the broader peer group, despite its return on equity being assessed as high, albeit influenced by leverage.
Compared with the US banks industry average P/E of 11.8x and a peer average of 18.1x, AGI’s 9x multiple is markedly lower. This shows the market is assigning a discount to AGI relative to both its industry and closer peers based on the figures available.
Result: Price-to-earnings of 9x (UNDERVALUED)
However, you still need to weigh risks around Brazil specific regulation for social security and payroll lending, as well as execution on its AI heavy cloud platform.
Another view: DCF says the stock looks expensive
That 9x P/E may look reasonable, but our DCF model tells a very different story. With the share price at $11.00 and our future cash flow value estimate at $1.99 per share, the model points to AGI trading well above its cash flow based value. Which signal do you trust more?
Simply Wall St performs a discounted cash flow (DCF) on every stock in the world every day (check out AGI for example). We show the entire calculation in full. You can track the result in your watchlist or portfolio and be alerted when this changes, or use our stock screener to discover 53 high quality undervalued stocks. If you save a screener we even alert you when new companies match - so you never miss a potential opportunity.
Build Your Own AGI Narrative
If you see the numbers differently or prefer to piece together your own view, you can build a complete, data backed story in minutes, starting with Do it your way.
A great starting point for your AGI research is our analysis highlighting 2 key rewards and 2 important warning signs that could impact your investment decision.
Looking for more investment ideas?
If you are serious about building a stronger portfolio, do not stop at AGI. Tap into curated stock ideas that match different goals and risk levels.
- Target value opportunities with 53 high quality undervalued stocks that pair solid fundamentals with prices that may not fully reflect the underlying businesses.
- Prioritise resilience by scanning 85 resilient stocks with low risk scores designed to spotlight companies with fewer red flags and more dependable profiles.
- Hunt for future leaders early through our screener containing 23 high quality undiscovered gems where quality companies sit off the usual radar.
This article by Simply Wall St is general in nature. We provide commentary based on historical data and analyst forecasts only using an unbiased methodology and our articles are not intended to be financial advice. It does not constitute a recommendation to buy or sell any stock, and does not take account of your objectives, or your financial situation. We aim to bring you long-term focused analysis driven by fundamental data. Note that our analysis may not factor in the latest price-sensitive company announcements or qualitative material. Simply Wall St has no position in any stocks mentioned.