Amazon (AMZN) Stock After Recent AI And Cloud Investments Is There Still An Opportunity
Amazon.com, Inc. AMZN | 0.00 |
- If you are wondering whether Amazon.com is priced fairly or if the recent share moves have created an opportunity, this article breaks down what the current valuation signals actually mean for you.
- The stock last closed at US$244.39, with returns of 2.4% over the past week, a decline of 8.2% over the last month, and gains of 7.9% year to date, 16.5% over 1 year, 89.0% over 3 years, and 43.7% over 5 years.
- Recent headlines around Amazon.com have focused on the company’s ongoing investments in its core retail and cloud operations, along with continued attention on its role in areas such as logistics and digital advertising. This broader news backdrop helps frame how investors are reacting to the stock’s performance across different timeframes.
- On Simply Wall St’s valuation checks, Amazon.com currently scores 4 out of 6, and the rest of this article will compare what different valuation methods say about that score while also pointing to an even more useful way to think about valuation at the end.
Approach 1: Amazon.com Discounted Cash Flow (DCF) Analysis
A Discounted Cash Flow, or DCF, model estimates what Amazon.com might be worth today by projecting future cash flows and then discounting them back into present dollars.
For Amazon.com, the latest twelve month Free Cash Flow is about $37.1b. Using a 2 Stage Free Cash Flow to Equity model, analysts and extrapolated estimates project Free Cash Flow reaching about $182.4b in 2030, with interim forecasts that include a dip in 2026 followed by higher figures in later years. Simply Wall St uses analyst inputs where available for the next few years, then extends those forecasts further out.
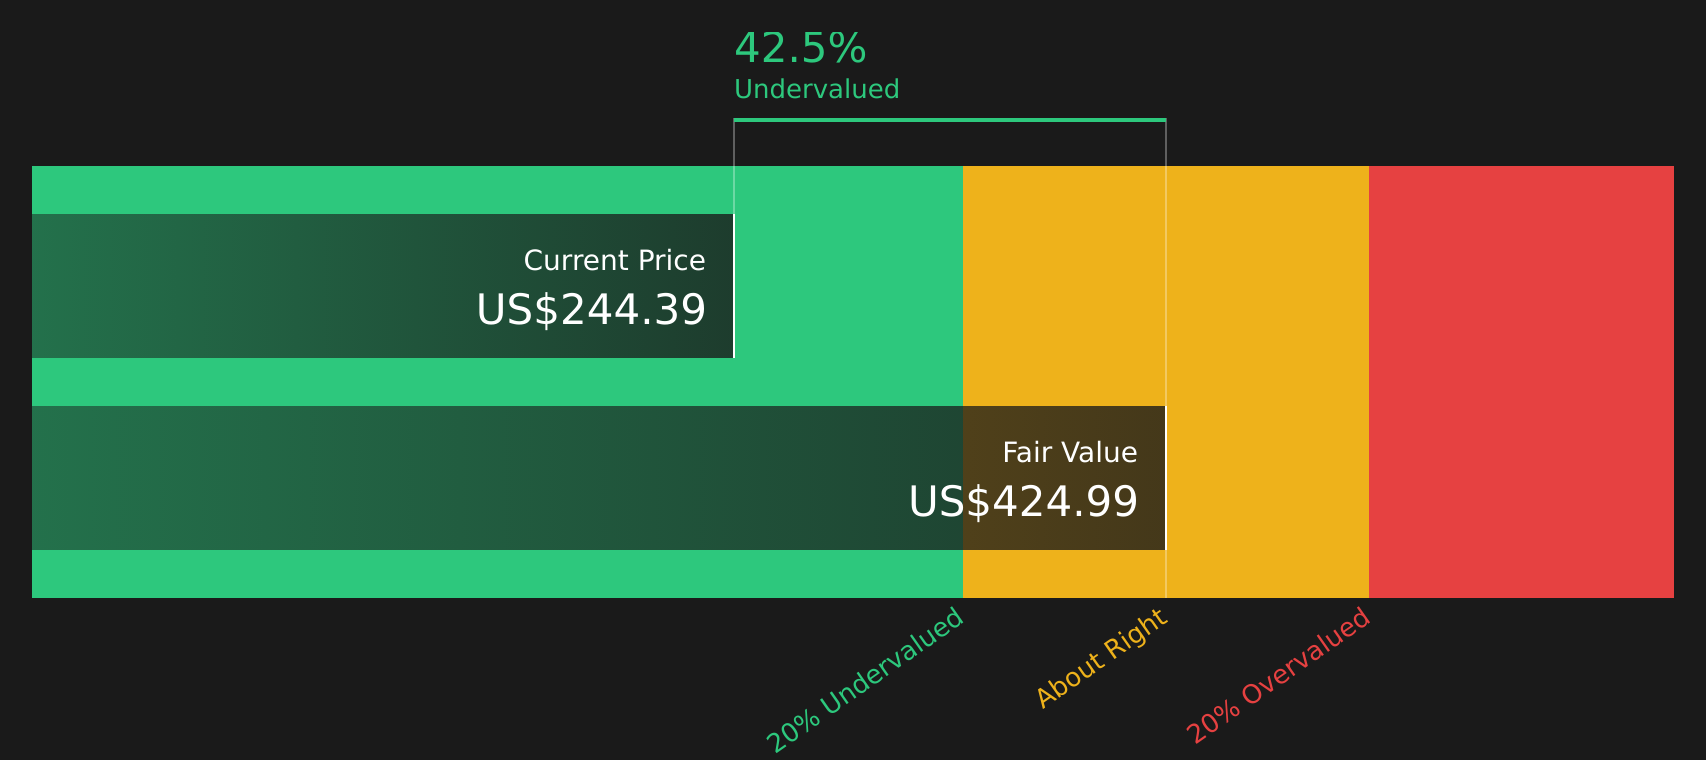
When all those projected cash flows are discounted back to today, the DCF model suggests an intrinsic value of about $425 per share. Compared with the recent share price of $244.39, this implies Amazon.com is trading at roughly a 42.5% discount to that DCF estimate, which signals the stock screens as materially undervalued on this model.
Result: UNDERVALUED
Our Discounted Cash Flow (DCF) analysis suggests Amazon.com is undervalued by 42.5%. Track this in your watchlist or portfolio, or discover 45 more high quality undervalued stocks.
Approach 2: Amazon.com Price vs Earnings
For profitable companies like Amazon.com, the P/E ratio is a common way to gauge how much you are paying for each dollar of earnings. It connects the share price directly to current profitability, which many investors use as a quick yardstick when comparing stocks.
What counts as a “normal” P/E ratio usually reflects how the market views a company’s growth prospects and risk. Higher expected growth or lower perceived risk can justify a higher multiple, while slower growth or higher uncertainty tend to go with a lower one.
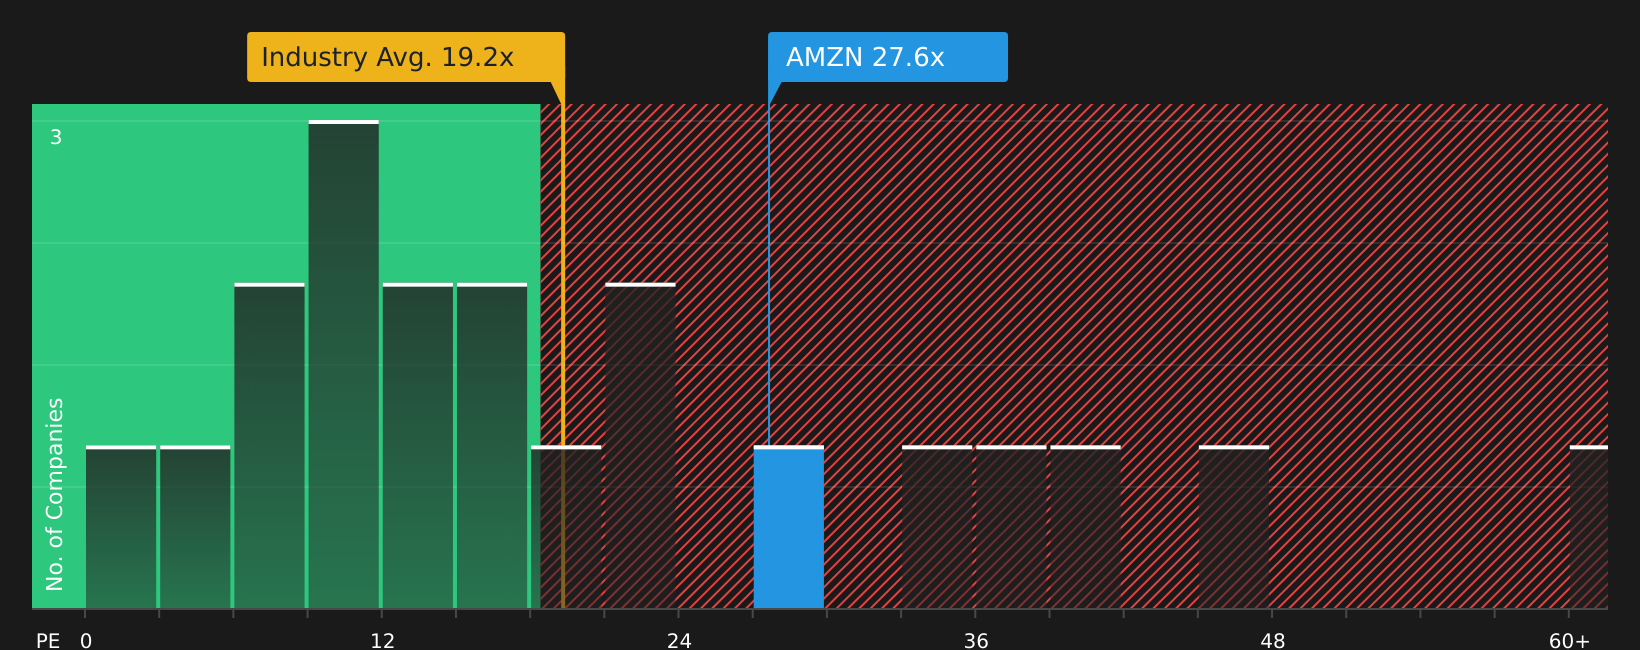
Amazon.com currently trades on a P/E of 29.0x, compared with an average of 22.7x for its peers and 18.9x for the Multiline Retail industry. Simply Wall St’s Fair Ratio for Amazon.com is 45.0x. This Fair Ratio is a proprietary estimate of what the P/E might be given its earnings growth profile, industry, profit margins, market cap and risk characteristics. It can be more informative than a simple comparison with peers or industry averages because it adjusts for those company specific factors rather than assuming one multiple fits all.
Since the Fair Ratio of 45.0x is above the current P/E of 29.0x, this framework indicates the stock screens as undervalued on this metric.
Result: UNDERVALUED
P/E ratios tell one story, but what if the real opportunity lies elsewhere? Start investing in legacies, not executives. Discover our 20 top founder-led companies.
Upgrade Your Decision Making: Choose your Amazon.com Narrative
Earlier it was mentioned that there is an even better way to understand valuation, so this is where Narratives come in, letting you attach a clear story about Amazon.com to the numbers you are using for fair value, future revenue, earnings and margins.
A Narrative is simply your view of how a company’s business works and where it is heading, written out as a short story and then translated into a forecast, so your expectations about things like AWS, retail, advertising or AI fed logistics sit directly behind the cash flow and valuation numbers you are using.
On Simply Wall St, Narratives live inside the Community page and are designed to be easy to use. You can read or create one by adjusting a few key assumptions, see the implied fair value that follows from that story, and compare it instantly to today’s share price to help you decide whether the stock looks expensive or attractive on your view.
Because Narratives are tied into live data, they update automatically when fresh information arrives, such as new earnings, news on capex plans or analyst estimate changes. The fair value linked to your Amazon.com story keeps moving as the facts change instead of staying frozen at the moment you built it.
For Amazon.com, one investor Narrative on Simply Wall St assumes a fair value of about US$168.12 per share based on relatively cautious growth and margin inputs. Another Narrative sits much higher at roughly US$475.09 per share using stronger assumptions for revenue growth and profitability. This shows how two reasonable stories about the same company can lead to very different fair values and therefore very different decisions when you compare those values to the current share price.
For Amazon.com however we will make it really easy for you with previews of two leading Amazon.com Narratives:
Fair value in this Narrative: US$450.00 per share
Implied discount to this fair value versus the recent price of US$244.39: about 45.7% below the Narrative fair value
Revenue growth assumption: 8.95%
- The Narrative sees Amazon.com compressing margins on purpose to fund a large AI and infrastructure spending cycle across AWS, advertising and automated retail.
- It frames current margins as temporary, with the view that higher utilization and a richer mix from AWS and advertising could support a stronger net margin profile over time.
- The author’s conclusion is that at US$450 per share, the focus is on Amazon.com’s potential future earnings capacity rather than on today’s reported margins.
Fair value in this Narrative: US$234.75 per share
Implied premium to this fair value versus the recent price of US$244.39: about 4.1% above the Narrative fair value
Revenue growth assumption: 13.6%
- This Narrative highlights Amazon.com’s breadth, including e commerce, AWS, advertising, Prime and devices, and sets out detailed pros and cons for the stock.
- The author walks through 2Q25 figures, guidance and a long list of product and customer wins, while also flagging issues such as AWS competition, power and chip constraints and tariff uncertainty.
- It arrives at a fair value of US$234.75 using growth projections and return targets, with the view that this is a reasonable price given both the opportunities and the execution risks laid out.
Together, these two Community Narratives show how different assumptions about Amazon.com’s margins, growth and execution can lead to very different views of fair value. This is exactly the kind of context Narratives are designed to give you before you decide which story best matches your own expectations.
Do you think there's more to the story for Amazon.com? Head over to our Community to see what others are saying!

This article by Simply Wall St is general in nature. We provide commentary based on historical data and analyst forecasts only using an unbiased methodology and our articles are not intended to be financial advice. It does not constitute a recommendation to buy or sell any stock, and does not take account of your objectives, or your financial situation. We aim to bring you long-term focused analysis driven by fundamental data. Note that our analysis may not factor in the latest price-sensitive company announcements or qualitative material. Simply Wall St has no position in any stocks mentioned.