American Airlines (AAL) Stock After 58% One-Year Rally Is The Valuation Now Stretched?
American Airlines Group Inc. AAL | 0.00 |
- If you are trying to work out whether American Airlines Group stock offers value at its recent US$17.57 close, the starting point is understanding how its current price lines up with different valuation methods.
- The stock has seen sharp moves recently, with returns of 9.9% over 7 days, 18.4% over 30 days, 13.5% year to date and 57.9% over 1 year. The 3 year and 5 year returns are essentially flat at a 0.2% decline and an 18.3% decline, respectively.
- Recent coverage of American Airlines Group has focused on the stock's strong 1 year return and what that might mean for investors reassessing risk and reward. This provides important context for anyone asking whether the current share price already reflects the latest expectations around the business.
- Against this backdrop, American Airlines Group currently scores 1 out of 6 on Simply Wall St's valuation checks, as shown in the valuation score. The sections that follow will break down traditional valuation approaches while keeping an eye on an arguably better way to think about value that will be covered at the end of the article.
American Airlines Group scores just 1/6 on our valuation checks. See what other red flags we found in the full valuation breakdown.
Approach 1: American Airlines Group Discounted Cash Flow (DCF) Analysis
A Discounted Cash Flow, or DCF, model estimates what American Airlines Group stock could be worth by projecting future cash flows and discounting them back to today using a required rate of return. It is essentially asking what those future dollars are worth in current terms.
For American Airlines Group, the model used here is a 2 Stage Free Cash Flow to Equity approach, based on cash flows available to shareholders. The latest twelve month Free Cash Flow is about $1.66b. Analyst inputs cover the nearer years, then Simply Wall St extrapolates further out, with projected Free Cash Flow of $1.30b in 2029 and a ten year path that runs from $356.4m in 2026 to about $1.70b in 2035, all in $.
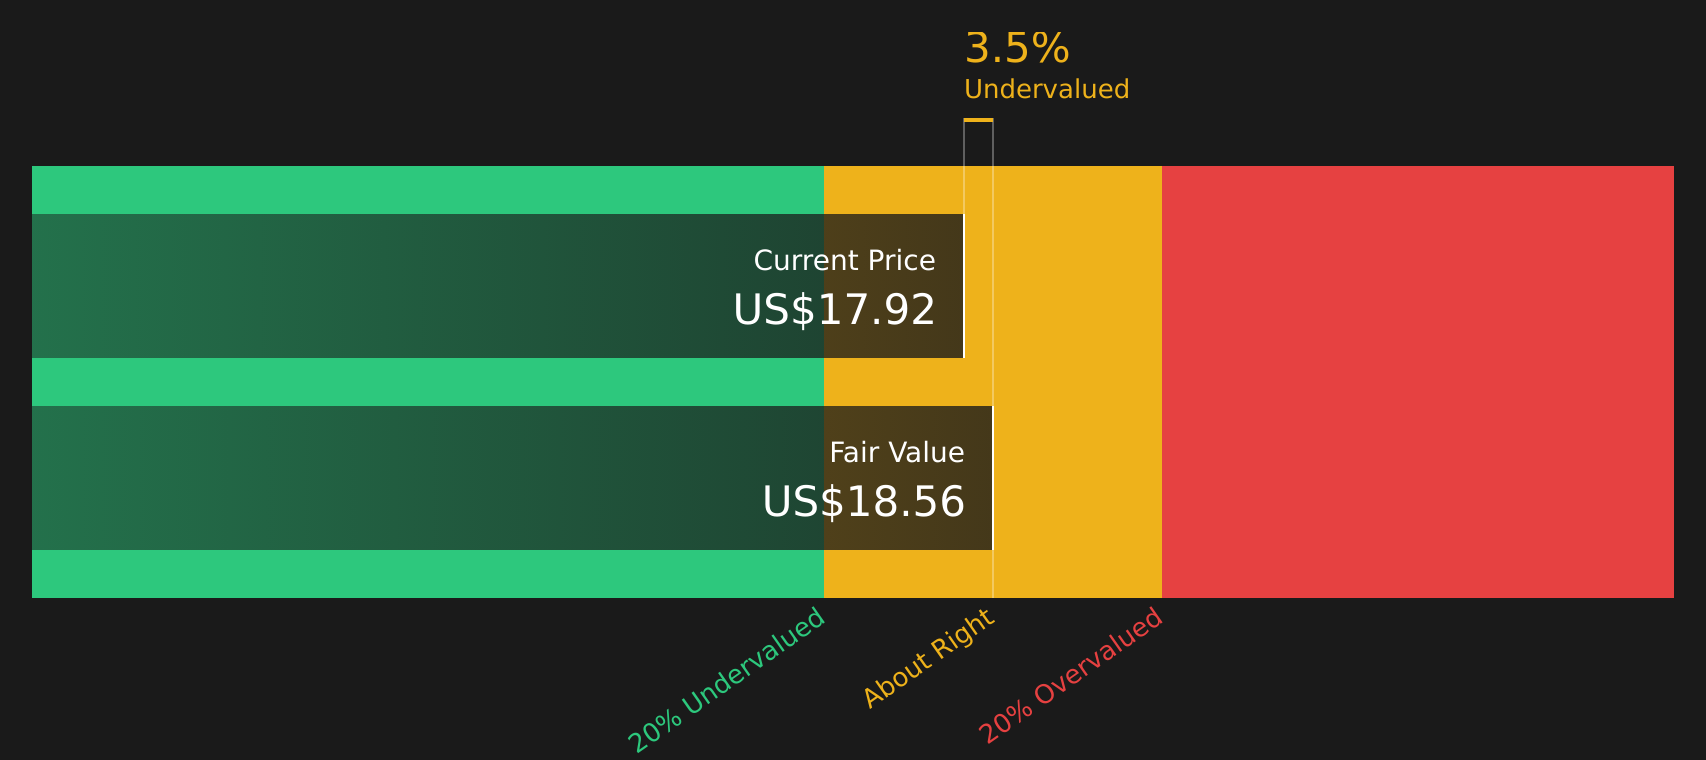
When these projected cash flows are discounted back and summed, the model arrives at an estimated intrinsic value of $18.56 per share. Compared with the recent share price of $17.57, this implies the stock is about 5.3% undervalued, which is a relatively small gap.
Result: ABOUT RIGHT
American Airlines Group is fairly valued according to our Discounted Cash Flow (DCF), but this can change at a moment's notice. Track the value in your watchlist or portfolio and be alerted on when to act.
Approach 2: American Airlines Group Price vs Earnings
For profitable companies like American Airlines Group, the P/E ratio is a widely used way to relate what you pay for the stock to the earnings it generates per share. It gives you a quick sense of how much the market is willing to pay for each dollar of current earnings.
What counts as a “normal” or “fair” P/E often reflects expectations for future growth and the risk investors see in those earnings. Higher growth or lower perceived risk can support a higher P/E, while slower growth or higher risk tends to align with a lower multiple.
American Airlines Group currently trades on a P/E of 57.53x, compared with an Airlines industry average of 10.47x and a peer average of 32.67x. Simply Wall St’s Fair Ratio for the stock is 42.36x, which is its estimate of a more suitable P/E based on factors such as earnings growth, industry, profit margins, market cap and identified risks.
This Fair Ratio is more tailored than a simple comparison with peers or the industry because it adjusts for the company’s specific profile rather than using broad group averages.
With the current P/E of 57.53x sitting above the Fair Ratio of 42.36x, the stock screens as overvalued on this measure.
Result: OVERVALUED

P/E ratios tell one story, but what if the real opportunity lies elsewhere? Start investing in legacies, not executives. Discover our 20 top founder-led companies.
Upgrade Your Decision Making: Choose Your American Airlines Group Narrative
Earlier sections compared American Airlines Group to traditional metrics. Narratives take you a step further by letting you attach a clear story to your numbers, so you can link what you believe about the company to a forecast for revenue, earnings and margins, and then to your own view of fair value.
On Simply Wall St’s Community page, Narratives are an easy tool used by millions of investors to set an assumed fair value and key forecasts, then line that up against the current share price to decide whether American Airlines Group looks attractive, looks expensive, or feels about right for their goals.
Narratives also update as new information like earnings reports or news affects the stock. This helps keep your fair value view aligned with the latest data rather than a static spreadsheet that quickly goes out of date.
For example, one American Airlines Group Narrative currently anchors on a fair value of about US$75.83 per share, while another sits closer to US$10.61. That spread reflects very different stories about balance sheet risk, demand strength and long term earnings power, which you can compare directly to your own view before deciding how the stock fits your portfolio.
For American Airlines Group however we will make it really easy for you with previews of two leading American Airlines Group Narratives:
These sit on opposite sides of the debate around the stock, which helps you see how different assumptions about earnings power, balance sheet risk and growth can lead to very different fair value estimates.
Fair value: US$75.83
Implied undervaluation vs last close: about 76.8%
Revenue growth assumption: 4.9%
- The narrative, titled "The Big Four Dominance", focuses on American Airlines Group as a core US legacy carrier with a wide network and a large loyalty program that generates high margin revenue.
- It highlights a balance sheet turnaround thesis, with earlier commentary pointing to debt reduction plans and fleet simplification as key supports for the long term case.
- On the numbers, it uses a projected 2030 EPS of US$4.14 and a 15x future P/E to arrive at a potential price in the low US$90s, then discounts that back to a fair value of US$75.83.
Fair value: US$10.61
Implied overvaluation vs last close: about 65.6%
Revenue growth assumption: 2.5%
- The bear case centers on American Airlines Group having a weaker balance sheet than other US legacy carriers, with high debt and negative equity viewed as key vulnerabilities.
- It argues that this capital structure leaves the company highly exposed if travel demand softens, with pressure on both revenues and margins in a competitive market.
- Even while acknowledging efforts to improve yields through Premium Economy and potential benefits from easier refinancing conditions, the narrative still sees the stock as unattractive outside of very strong economic conditions.
Taken together, these community Narratives frame a wide fair value range for American Airlines Group and make it clear that the stock sits at the intersection of two very different stories about earnings resilience and balance sheet risk.
If you want to see how other investors are weighing those trade offs and what assumptions sit behind their targets, you can review the full set of Narratives alongside your own view of the stock.
Do you think there's more to the story for American Airlines Group? Head over to our Community to see what others are saying!

This article by Simply Wall St is general in nature. We provide commentary based on historical data and analyst forecasts only using an unbiased methodology and our articles are not intended to be financial advice. It does not constitute a recommendation to buy or sell any stock, and does not take account of your objectives, or your financial situation. We aim to bring you long-term focused analysis driven by fundamental data. Note that our analysis may not factor in the latest price-sensitive company announcements or qualitative material. Simply Wall St has no position in any stocks mentioned.