American Tower (AMT) Valuation After DISH Termination And Recent Dividend And Balance Sheet Moves
American Tower Corporation AMT | 0.00 |
Termination with DISH and what it means for American Tower stock
American Tower (AMT) has terminated its Strategic Collocation Agreement with DISH Wireless after a payment default, while stating the move should not affect its 2026 results. Litigation over DISH obligations continues.
This follows recent quarterly results that included revenue and net income growth, a 5% dividend increase, and actions on the balance sheet such as a partial early redemption of 4.125% senior unsecured notes due 2027.
The share price has reacted quickly to the DISH news and recent debt moves, with a 6.4% 1 day share price return and an 8.9% 30 day share price return. However, the 1 year total shareholder return has still declined 7.0%, suggesting short term momentum is picking up while longer term performance remains subdued.
If this kind of rebound has you thinking about other infrastructure plays tied to data and connectivity, it is worth scanning a wider set of potential ideas through 48 AI infrastructure stocks
With AMT shares up over the past month but still showing a 7.0% decline in 1 year total return and trading below both analyst targets and some intrinsic estimates, is this a reset that creates an opening, or is the market already pricing in future growth?
Preferred P/E of 31.1x: Is it justified?
American Tower currently trades on a P/E of 31.1x, a level that sits slightly above the US Specialized REITs industry average of 30.4x but below the peer average of 46.5x.
The P/E ratio compares the share price to earnings per share and is a quick gauge of how much investors are paying for each dollar of current earnings. For a large communications REIT with $10.8b of revenue and $2.9b of net income, this ratio is often the first lens investors use to assess how earnings quality, growth and balance sheet structure are being reflected in the price.
The data indicates a mixed picture. On one hand, American Tower is described as good value when its 31.1x P/E is compared with an estimated fair P/E of 33.9x and with a much higher peer average of 46.5x. On the other hand, that same 31.1x P/E is described as expensive relative to the broader US Specialized REITs industry average of 30.4x. In addition, recent earnings growth of 0.1% over the past year is below both its own 5 year average of 4.3% and the industry’s 9% figure.
When stacked against the industry, the message is clear. American Tower’s current 31.1x P/E asks investors to pay a small premium to the sector even though its recent earnings growth has been slower than both the industry and the wider US market. However, relative to its estimated fair P/E and the higher peer group average, the same 31.1x looks more conservative and could signal that the market is not assigning the same multiple as some comparable stocks or as the fair ratio model suggests it could move toward over time.
Result: Price-to-Earnings of 31.1x (ABOUT RIGHT)
However, there are still clear pressure points, including customer concentration highlighted by the DISH dispute and the longer term share price decline, which could signal weaker investor confidence.
Another way to look at value
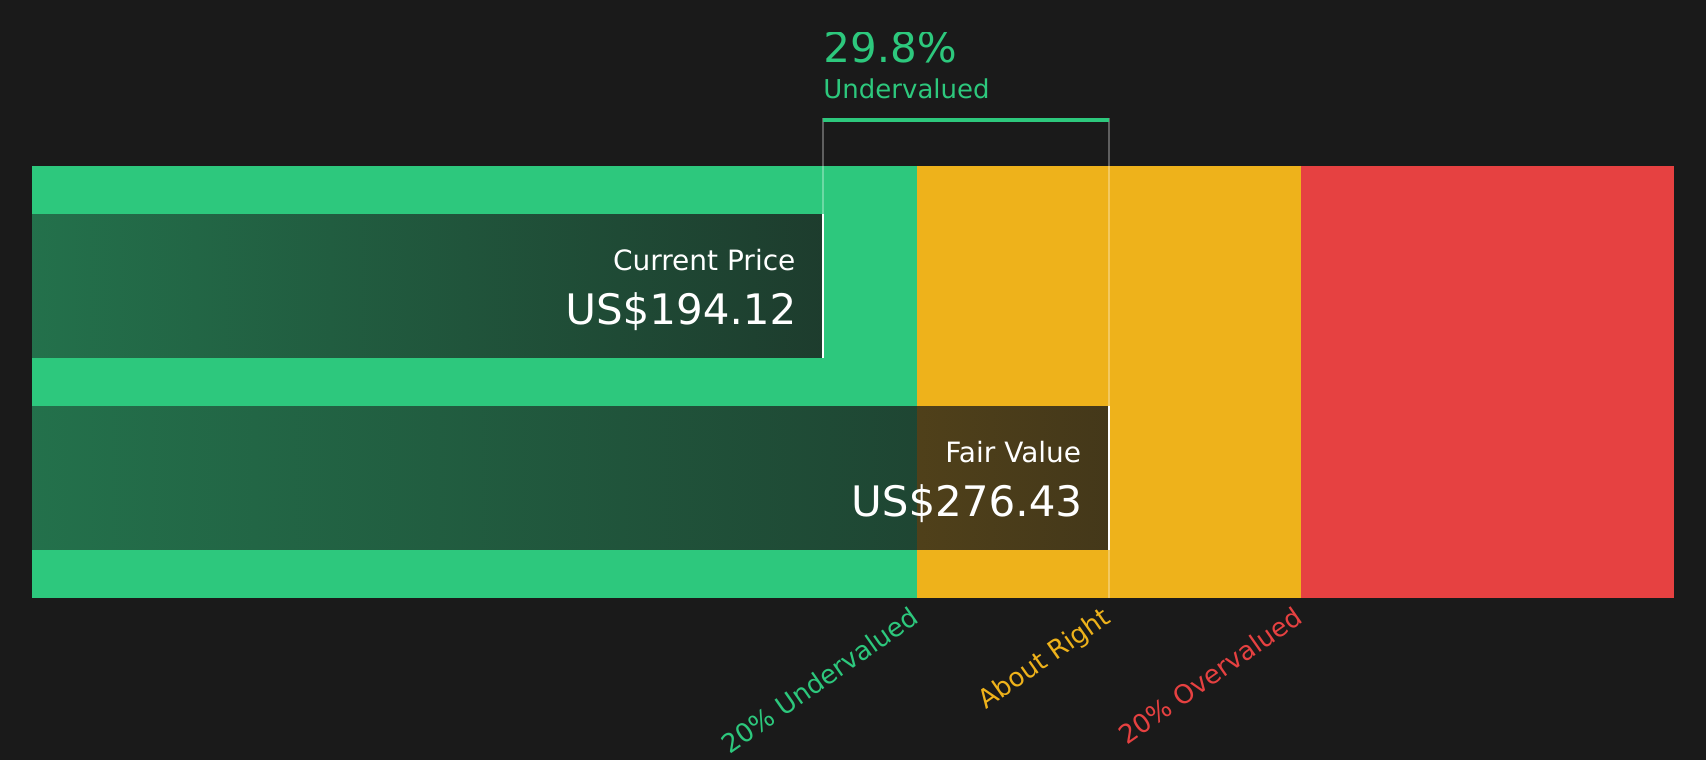
The P/E workup says American Tower looks roughly in line with where the market might expect it to trade, but the SWS DCF model offers a sharper contrast. On that view, the stock at $193.91 sits below an estimated future cash flow value of $273.82, which frames valuation risk and opportunity very differently. Is the gap a margin of safety, or is it a sign the model is too optimistic?
Simply Wall St performs a discounted cash flow (DCF) on every stock in the world every day (check out American Tower for example). We show the entire calculation in full. You can track the result in your watchlist or portfolio and be alerted when this changes, or use our stock screener to discover 47 high quality undervalued stocks. If you save a screener we even alert you when new companies match - so you never miss a potential opportunity.
Next Steps
If the mix of pressure points and potential rewards feels finely balanced, act while the data is fresh and shape your own view with 4 key rewards and 1 important warning sign.
Looking for more investment ideas?
If this situation has sharpened your focus, do not stop at one stock. Broaden your watchlist now so you are not late to the next move.
- Hunt for quality at a discount by scanning 47 high quality undervalued stocks that pair solid fundamentals with prices that may not fully reflect them yet.
- Strengthen your income core by reviewing 10 dividend fortresses that offer higher yields with an emphasis on staying power.
- Prioritize resilience by filtering for 64 resilient stocks with low risk scores that score well on stability and financial risk metrics.
This article by Simply Wall St is general in nature. We provide commentary based on historical data and analyst forecasts only using an unbiased methodology and our articles are not intended to be financial advice. It does not constitute a recommendation to buy or sell any stock, and does not take account of your objectives, or your financial situation. We aim to bring you long-term focused analysis driven by fundamental data. Note that our analysis may not factor in the latest price-sensitive company announcements or qualitative material. Simply Wall St has no position in any stocks mentioned.