American Tower (AMT) Valuation After Earnings Beat And Raised 2026 Outlook Draws Fresh Analyst Attention
American Tower Corporation AMT | 0.00 |
Why American Tower’s latest quarter is drawing fresh attention
American Tower (AMT) has moved into focus after first quarter earnings topped expectations, full year 2026 guidance was raised, and international operations such as Latin America and Europe featured prominently in management’s outlook.
That earnings beat and higher 2026 guidance have come alongside a 90 day share price return of 5.06% and a year to date share price return of 3.07%, even though the 1 year total shareholder return is a 14.89% decline. As a result, recent momentum contrasts with a weaker longer term picture.
If this kind of telecom and data infrastructure story interests you, it could be a good moment to see what else is moving across 38 AI infrastructure stocks
Strong recent results, a higher 2026 outlook, and a double digit 1 year total return decline create a clear tension for investors: is American Tower still trading at a discount, or has the market already priced in future growth?
Price-to-Earnings of 28.9x: Is it justified?
On a P/E of 28.9x at a last close of $180.16, American Tower screens slightly more expensive than the North American Specialized REITs average of 28.4x, even though it is assessed as good value against several fair value checks.
The P/E multiple compares the current share price to earnings per share. For a company like American Tower that earns rental income from towers and data centers, it is a quick way to see how much investors are paying for each dollar of profit.
Here, the stock is described as expensive versus the North American Specialized REITs industry average P/E of 28.4x. However, it screens as good value against an estimated fair P/E of 34.6x and a peer average of 47.1x. That contrast suggests the broader peer group is carrying much richer expectations, while the fair ratio reflects a level the market could potentially move toward if sentiment and cash flow expectations align with those implied by the SWS model.
Result: Price-to-Earnings of 28.9x (UNDERVALUED)
However, investors still have to weigh risks such as a 14.89% 1-year total return decline and heavy reliance on property operations across multiple international markets.
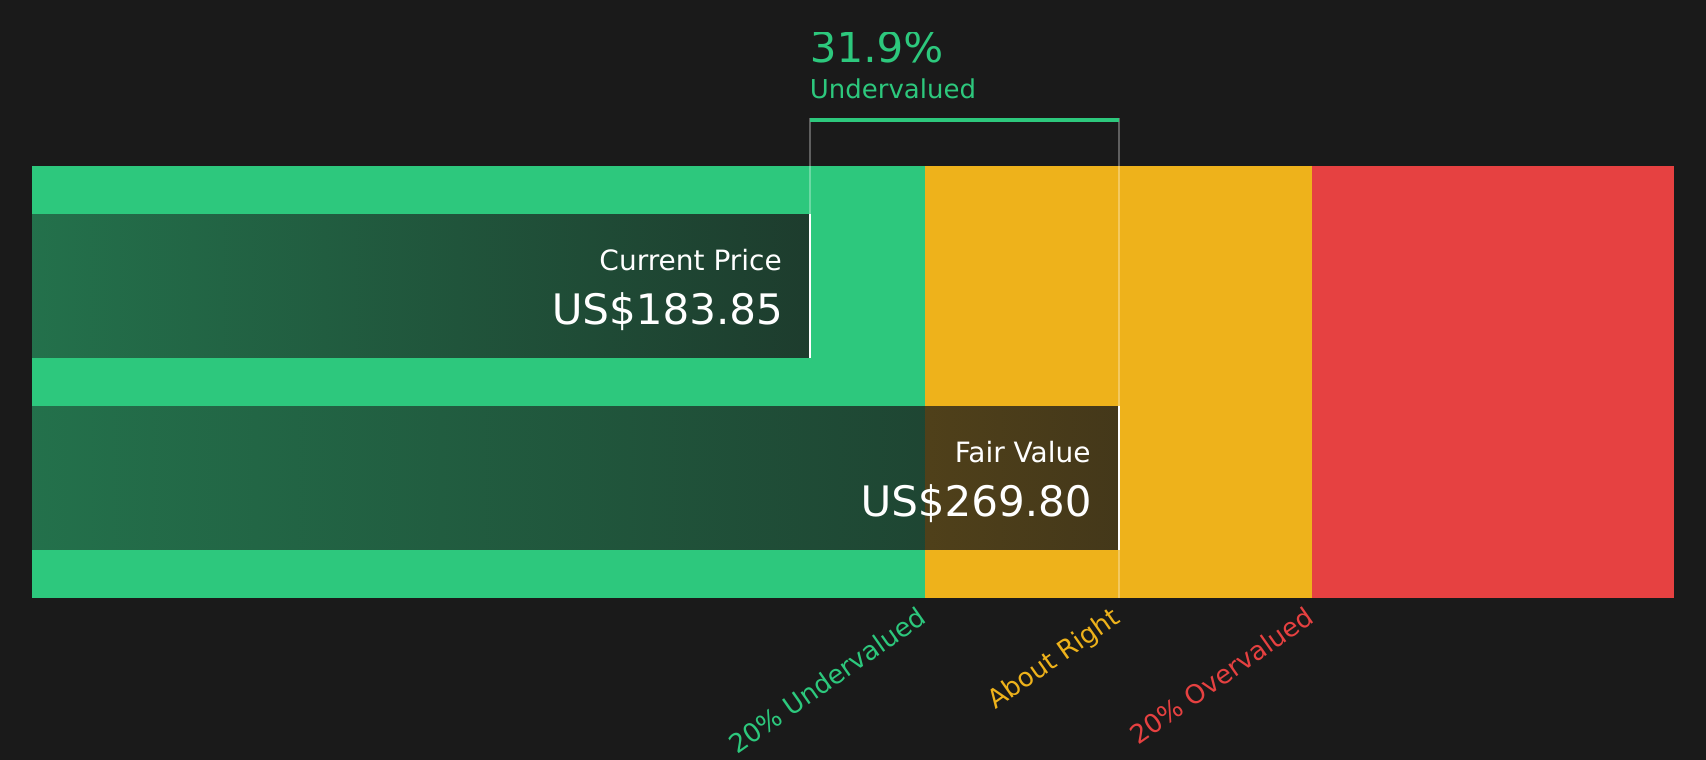
Another way to look at value: DCF vs earnings multiple
While the 28.9x P/E suggests American Tower is only slightly expensive relative to the Specialized REITs average, the SWS DCF model points in a different direction. With the stock at $180.16 versus an estimated future cash flow value of $268.33, it is described as trading 32.9% below fair value. Which signal do you trust more: current earnings or long term cash flows?
Simply Wall St performs a discounted cash flow (DCF) on every stock in the world every day (check out American Tower for example). We show the entire calculation in full. You can track the result in your watchlist or portfolio and be alerted when this changes, or use our stock screener to discover 44 high quality undervalued stocks. If you save a screener we even alert you when new companies match - so you never miss a potential opportunity.
Next Steps
With sentiment clearly mixed, it makes sense to look at the numbers yourself and decide where you stand, especially as the balance of risks and rewards is finely poised according to the 4 key rewards and 1 important warning sign.
Looking for more investment ideas?
If American Tower has caught your eye, do not stop here, there are plenty of other stocks that could fit your goals across value, income, and stability.
- Target potential value opportunities by scanning 44 high quality undervalued stocks that pair stronger fundamentals with pricing that may look appealing.
- Boost your income watchlist by reviewing 12 dividend fortresses offering higher yields with a focus on consistency.
- Prioritize resilience by checking 74 resilient stocks with low risk scores that score well on financial strength and volatility.
This article by Simply Wall St is general in nature. We provide commentary based on historical data and analyst forecasts only using an unbiased methodology and our articles are not intended to be financial advice. It does not constitute a recommendation to buy or sell any stock, and does not take account of your objectives, or your financial situation. We aim to bring you long-term focused analysis driven by fundamental data. Note that our analysis may not factor in the latest price-sensitive company announcements or qualitative material. Simply Wall St has no position in any stocks mentioned.