American Tower (AMT) Valuation Check After Q1 2026 Earnings Beat And Raised Full Year Guidance
American Tower Corporation AMT | 0.00 |
American Tower (AMT) is back in focus after its fiscal Q1 2026 earnings beat, with data center revenue up 17% and higher operating margins following the completed exit from India and the simplification of its portfolio.
Despite the Q1 2026 earnings beat and raised full year guidance, recent share price performance has been weak. The stock is down 11.18% on a 90 day share price return and total shareholder return is down 17.08% over the past year, suggesting sentiment has yet to fully reflect the data center growth story or improved margins.
If the renewed interest in wireless towers and data centers has you thinking more broadly about infrastructure, this could be a good moment to scan 42 AI infrastructure stocks
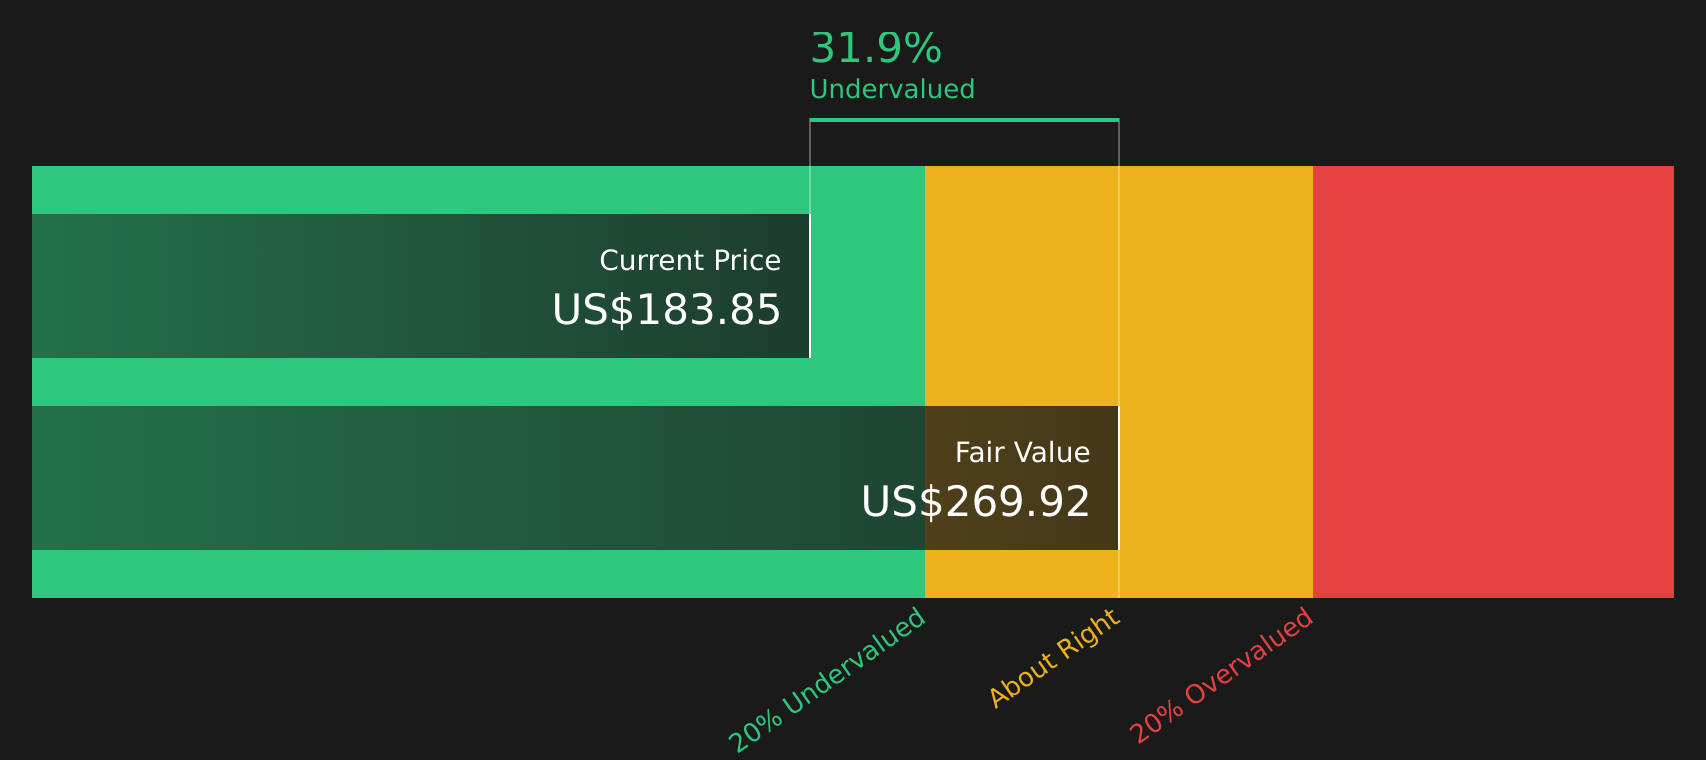
So with Q1 delivering an earnings beat, a higher full year outlook, and the stock still down over the past year even at about a 36% intrinsic discount, is this a mispriced infrastructure play, or is the market already banking on future growth?
Price-to-Earnings of 27.4x: Is it justified?
On simple valuation checks, American Tower screens as undervalued, with the stock trading at a P/E of 27.4x versus an estimated fair P/E of 34.6x and our intrinsic value estimate suggesting it trades about 35.8% below fair value at $170.63.
The P/E ratio compares the current share price to earnings per share and, for a REIT like American Tower, it offers a quick read on how the market is pricing current and expected profit from its tower and data center portfolio.
Here, the current P/E sits not only below the estimated fair P/E level but also below both the US Specialized REITs industry average of 29.3x and the peer average of 45.1x. This implies the market is assigning a more conservative earnings multiple than these benchmarks and could eventually move closer to that estimated fair ratio if sentiment or earnings expectations shift.
Compared with the sector, the 27.4x P/E looks restrained given both the industry average and peer group trade at higher multiples. Investors watching American Tower may see this as the market pricing in more modest expectations than those implied by the fair P/E model and analyst targets.
Result: Preferred multiple of Price-to-Earnings of 27.4x (UNDERVALUED)
However, you also need to weigh risks like multi-year share price weakness and the possibility that data center and tower demand falls short of current expectations.
Another way to look at value
Alongside the P/E check, the SWS DCF model also points to a gap, with American Tower at $170.63 compared with an estimated future cash flow value of $265.89, or about a 35.8% discount. If both earnings and cash flow views suggest a lower valuation, is the market being too cautious?
Simply Wall St performs a discounted cash flow (DCF) on every stock in the world every day (check out American Tower for example). We show the entire calculation in full. You can track the result in your watchlist or portfolio and be alerted when this changes, or use our stock screener to discover 50 high quality undervalued stocks. If you save a screener we even alert you when new companies match - so you never miss a potential opportunity.
Next Steps
Curious whether this setup leans more toward opportunity or risk for you personally? Act while the details are fresh in mind and weigh both sides by checking the 6 key rewards and 1 important warning sign
Looking for more investment ideas?
If American Tower has sharpened your focus, do not stop here. Broaden your watchlist with other angles on quality, value, and income that you might otherwise miss.
- Target resilience in your portfolio by scanning 66 resilient stocks with low risk scores that may hold up better when conditions turn tougher.
- Hunt for quality at a reasonable price by checking 50 high quality undervalued stocks that combine fundamentals with potentially appealing valuations.
- Strengthen your income stream by reviewing 12 dividend fortresses that pair higher yields with a focus on consistency.
This article by Simply Wall St is general in nature. We provide commentary based on historical data and analyst forecasts only using an unbiased methodology and our articles are not intended to be financial advice. It does not constitute a recommendation to buy or sell any stock, and does not take account of your objectives, or your financial situation. We aim to bring you long-term focused analysis driven by fundamental data. Note that our analysis may not factor in the latest price-sensitive company announcements or qualitative material. Simply Wall St has no position in any stocks mentioned.