

American Tower (AMT) Valuation Check As Mixed EPS And Revenue Forecasts Shape Earnings Expectations
American Tower Corporation AMT | 0.00 |
Recent analyst forecasts around American Tower (AMT) earnings, pointing to lower EPS alongside higher revenue and shifting segment trends, have put the stock in focus for investors who are watching how its business mix is evolving.
At a share price of US$178.21, American Tower’s recent 6.54% 1 month share price return contrasts with a 12.35% 1 year total shareholder return decline. This suggests fading longer term momentum even as short term sentiment improves ahead of earnings.
If you are weighing how communications infrastructure fits into a broader portfolio, this could be a good moment to widen your search and consider 38 AI infrastructure stocks
American Tower trades at US$178.21 with an indicated intrinsic discount of about 33% and a roughly 21% gap to the average analyst target, raising the question: is this a genuine opportunity, or is the market already pricing in future growth?
Preferred P/E of 32.9x: Is it justified?
American Tower currently trades on a P/E of 32.9x, which implies investors are paying a premium price for each dollar of earnings at the recent close of $178.21 compared with several peers.
The P/E ratio compares the share price with earnings per share. For a large communications real estate owner like American Tower, it provides a quick indication of how the market is valuing its earnings power relative to other REITs and listed companies.
Analysts assessing the stock see mixed valuation signals. On one hand, American Tower is described as good value when compared with its peer average P/E of 47.9x, suggesting the market is applying a lower multiple than some directly comparable names. On the other hand, relative to the broader North American specialized REITs industry average of 28.7x and an estimated fair P/E of 32.6x, the current 32.9x looks slightly elevated. This implies only a small gap between where the multiple sits today and where it could settle if pricing moved closer to that fair ratio estimate.
Result: Price-to-Earnings of 32.9x (ABOUT RIGHT)
However, investors still face risks if current revenue growth of 3.97% slows, or if long running share price declines continue to weigh on sentiment.
Another way to look at value
While the P/E discussion points to a price that looks roughly in line with a fair ratio of 32.6x, the SWS DCF model presents a different angle and suggests American Tower at $178.21 trades below an estimated future cash flow value of $264.18. Which signal do you treat as more important?
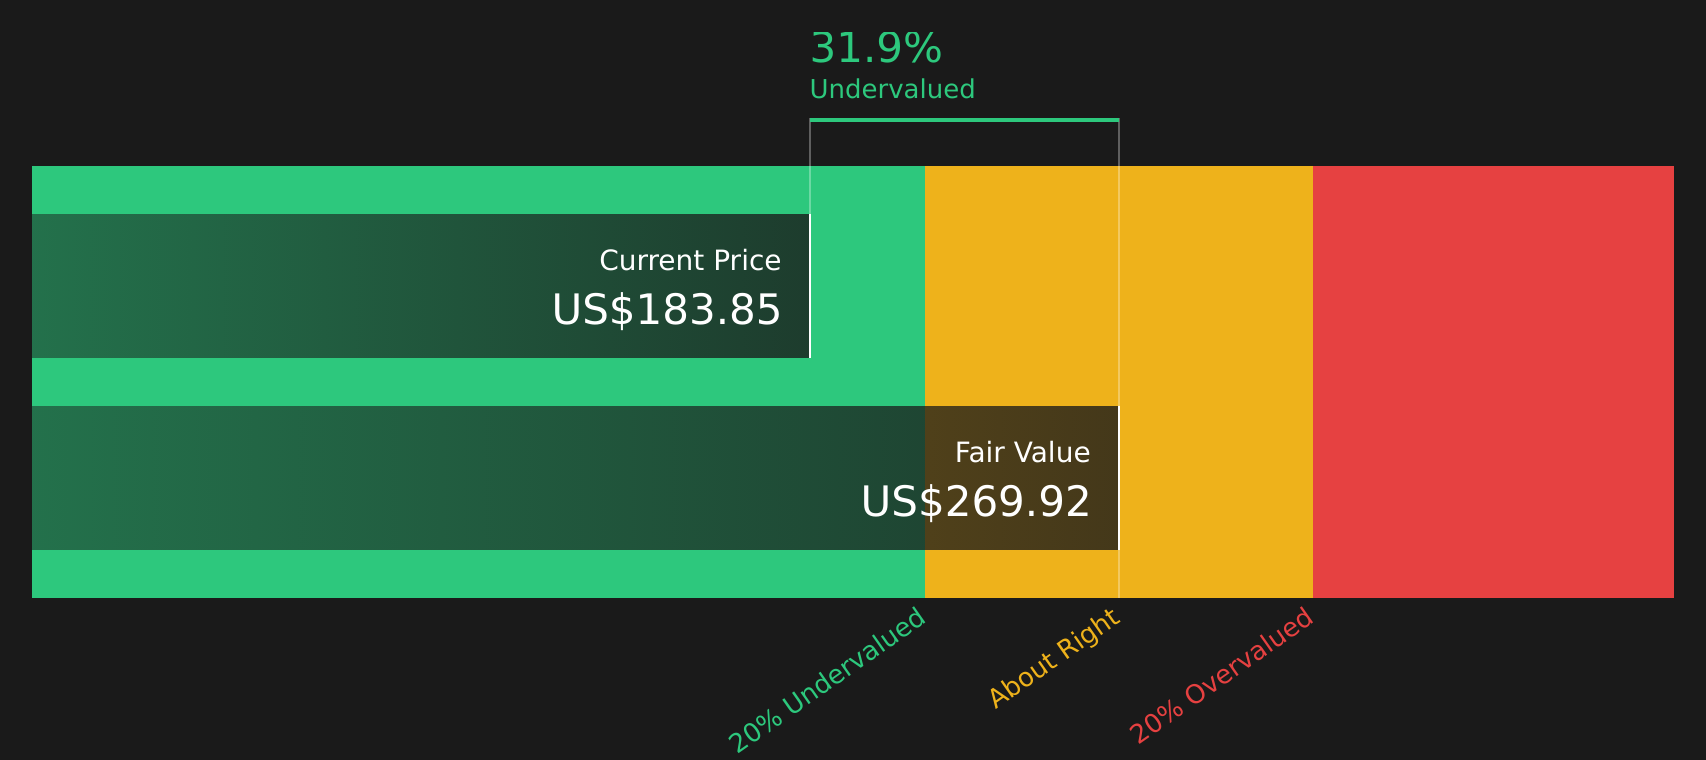
Simply Wall St performs a discounted cash flow (DCF) on every stock in the world every day (check out American Tower for example). We show the entire calculation in full. You can track the result in your watchlist or portfolio and be alerted when this changes, or use our stock screener to discover 56 high quality undervalued stocks. If you save a screener we even alert you when new companies match - so you never miss a potential opportunity.
Next Steps
The mix of signals around American Tower can feel conflicted, so do not sit on the fence. Review the full picture for yourself with 4 key rewards and 1 important warning sign
Looking for more investment ideas?
If American Tower is on your radar, do not stop there. Broaden your watchlist now so you are not late to the next opportunity the data highlights.
- Target quality at a discount by reviewing companies that pass strict value and fundamentals filters with the 56 high quality undervalued stocks.
- Prioritize resilience by focusing on businesses with stronger financial footing using the solid balance sheet and fundamentals stocks screener (42 results).
- Chase income opportunities by scanning for higher yielding payers that clear key checks through the 13 dividend fortresses.
This article by Simply Wall St is general in nature. We provide commentary based on historical data and analyst forecasts only using an unbiased methodology and our articles are not intended to be financial advice. It does not constitute a recommendation to buy or sell any stock, and does not take account of your objectives, or your financial situation. We aim to bring you long-term focused analysis driven by fundamental data. Note that our analysis may not factor in the latest price-sensitive company announcements or qualitative material. Simply Wall St has no position in any stocks mentioned.