AMETEK (AME) Stock After FARO Technologies Deal Is The Current Price Justified
AMETEK, Inc. AME | 0.00 |
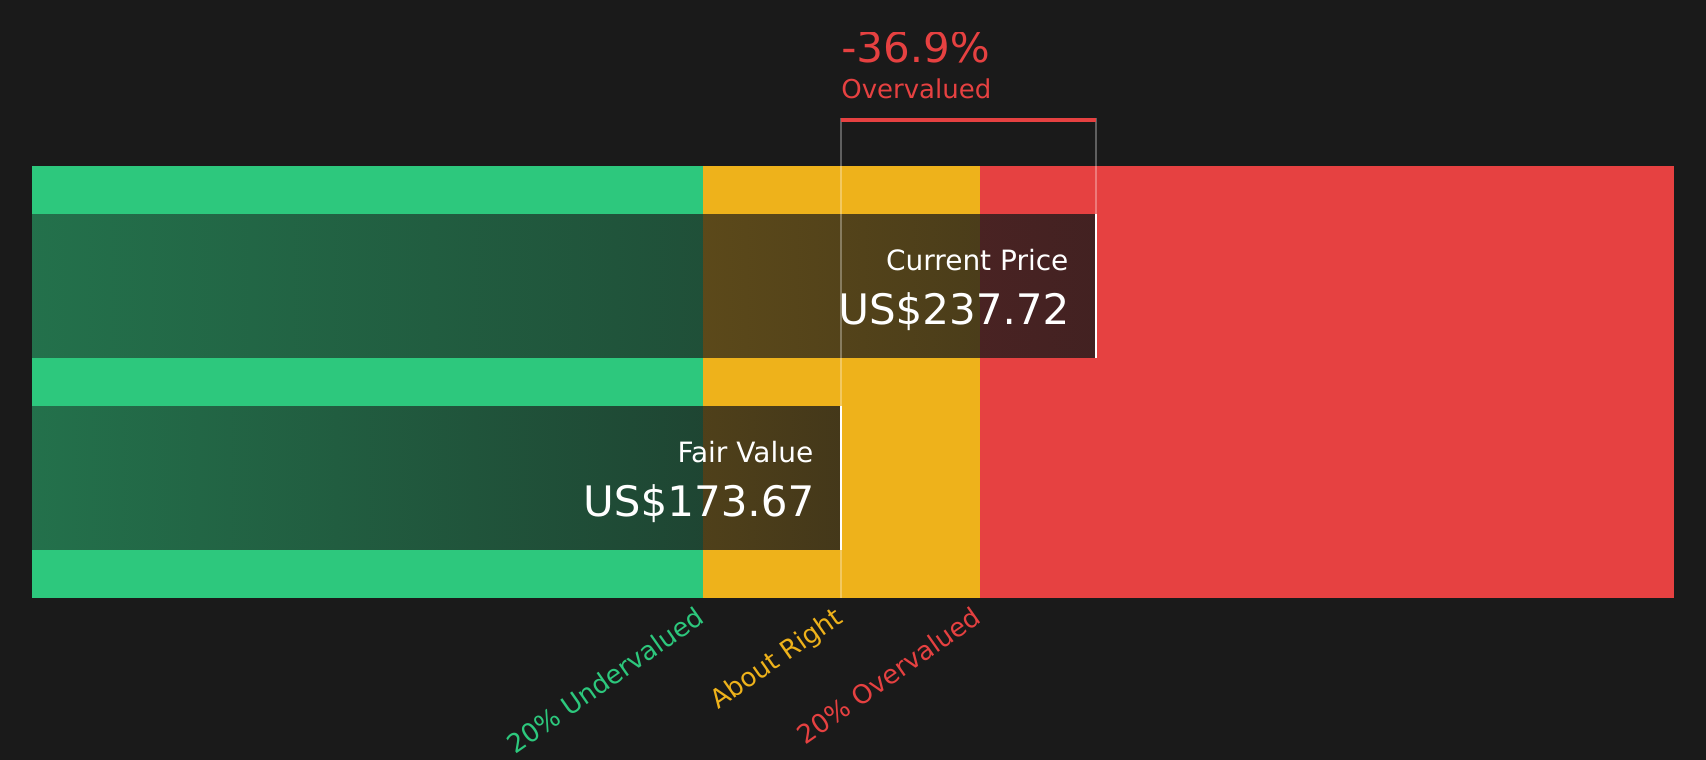
- Wondering if AMETEK at about US$227 per share offers fair value or if the price has run ahead of itself? This article looks at what the current valuation is really telling you.
- Over the short term the stock is up 0.3% over the last week, while the last month shows a 1.9% decline, and year to date the return stands at 8.6% with a 29.0% return over the past year and 48.3% and 79.3% over the last 3 and 5 years respectively.
- Recent coverage around AMETEK has focused on its role in the broader capital goods space and how investors are weighing quality, balance sheet strength and future growth expectations. This context helps explain why the stock has seen a mix of steady gains over longer periods and near term pullbacks as views on risk and opportunity shift.
- On Simply Wall St's valuation checks AMETEK scores 2 out of 6, as shown in its valuation score. The next step is to unpack how different valuation methods view the stock today and then look at a broader way to think about value that goes beyond any single model.
AMETEK scores just 2/6 on our valuation checks. See what other red flags we found in the full valuation breakdown.
Approach 1: AMETEK Discounted Cash Flow (DCF) Analysis
A Discounted Cash Flow model takes estimates of a company's future cash flows and discounts them back to today, aiming to translate those future dollars into a single current value per share.
For AMETEK, the model used is a 2 Stage Free Cash Flow to Equity approach built on cash flow projections. The latest twelve month Free Cash Flow is about $1.69b. Analyst estimates and extrapolated figures point to Free Cash Flow projections such as $1.87b in 2026 and $2.25b in 2028, with further years extended by Simply Wall St beyond the explicit analyst horizon.
When all these projected cash flows are discounted back to today in dollars, the model arrives at an estimated intrinsic value of about $161.18 per share. Compared with the current share price of about $227, the DCF output suggests AMETEK is about 40.9% above this intrinsic value estimate. This indicates the stock may be trading at a premium to this cash flow based view.
Result: OVERVALUED
Our Discounted Cash Flow (DCF) analysis suggests AMETEK may be overvalued by 40.9%. Discover 44 high quality undervalued stocks or create your own screener to find better value opportunities.
Approach 2: AMETEK Price vs Earnings
For profitable companies, the P/E ratio is a useful way to link what you pay for each share to the earnings that support that price. It helps you see how much the market is willing to pay for each dollar of profit.
What counts as a "normal" P/E depends a lot on growth expectations and risk. Higher expected earnings growth or lower perceived risk can support a higher P/E, while lower growth expectations or higher risk usually point to a lower, more conservative P/E range.
AMETEK currently trades on a P/E of about 34.1x. This sits below the Electrical industry average of about 38.4x and below the peer group average of roughly 40.9x, which suggests the stock is priced more conservatively than many peers using this simple comparison.
Simply Wall St’s Fair Ratio for AMETEK is about 26.6x. This is a proprietary estimate of what the P/E "should" be, given factors such as earnings growth, industry, profit margin, market cap and risk profile. Because it blends these company specific inputs, the Fair Ratio can offer a more tailored reference point than a broad industry or peer average.
Comparing the Fair Ratio of 26.6x to the actual P/E of 34.1x, AMETEK trades meaningfully higher than this tailored benchmark, which points to the stock being on the expensive side using this method.
Result: OVERVALUED

Wall Street's queuing for one rocket. While SpaceX counts down to its IPO, other companies tied to the new space race are already in orbit. → 20 Compelling Space Companies watchlist · Global Space Race Investing Ideas screener · Scan the sector by valuation on Rocket Lab's valuation page.
Upgrade Your Decision Making: Choose your AMETEK Narrative
Earlier it was mentioned that there is an even better way to think about value. On Simply Wall St that means using Narratives, which are simple stories you create about AMETEK that link your view on its business, your forecast for revenue, earnings and margins, and the fair value you think is reasonable. All of this sits inside an easy tool on the Community page that compares your Fair Value to the live share price and then updates automatically when fresh news or earnings land. One investor might build a higher value Narrative closer to US$280 that leans into themes like digital automation, sustainability focus and acquisitions such as FARO Technologies and First Aviation Services. Another might set a lower value around US$217 that gives more weight to risks like weaker end markets, reliance on deals and digital competition. You can see both side by side, choose the story you agree with, and use that as a clearer guide for your own decisions.
Do you think there's more to the story for AMETEK? Head over to our Community to see what others are saying!

This article by Simply Wall St is general in nature. We provide commentary based on historical data and analyst forecasts only using an unbiased methodology and our articles are not intended to be financial advice. It does not constitute a recommendation to buy or sell any stock, and does not take account of your objectives, or your financial situation. We aim to bring you long-term focused analysis driven by fundamental data. Note that our analysis may not factor in the latest price-sensitive company announcements or qualitative material. Simply Wall St has no position in any stocks mentioned.