

Anterix (ATEX) Joins Russell 2000 Indexes, Is The Valuation Already Too Rich?
Anterix Inc. ATEX | 0.00 |
Anterix (ATEX) has been added to both the Russell 2000 Growth-Defensive Index and the Russell 2000 Defensive Index, a change that can draw fresh attention from index-tracking funds and benchmark-aware investors.
The index additions come after a powerful run in Anterix’s share price, with a 30-day share price return of 59.12% and a 90-day share price return of 157.69%. This has contributed to a year-to-date share price return of 377.01% and a 1-year total shareholder return of 333.52%, which together indicate strong recent momentum rather than a short-lived move.
If you are looking beyond Anterix for other infrastructure related opportunities, it may be worth scanning the 35 power grid technology and infrastructure stocks for potential ideas.
Anterix now trades well above the average analyst target and at a premium to some estimates of fair value. The jump in the share price raises a simple question: is the market being too cautious or not cautious enough?
Preferred P/E of 22.8x: Is it justified for Anterix after the rally?
With Anterix closing at $106.04, the stock is trading on a P/E of 22.8x, which looks rich compared to both its own fair P/E estimate and telecom peers.
The P/E ratio compares the current share price with earnings per share and is a quick gauge of how much investors are willing to pay for each dollar of profit. For Anterix, a 22.8x P/E sits above the estimated fair P/E of 9.6x, as well as above the peer average of 19.5x and the global telecom industry average of 16.6x. This points to a relatively high earnings multiple.
This gap suggests the market is pricing in strong expectations around Anterix’s 900 MHz spectrum platform and future cash generation, even as earnings are forecast to decline by an average of 28% per year over the next three years. If the valuation were to move closer to the estimated fair P/E, that would imply a very different price level than today. As a result, the current premium appears to assume that a supportive earnings or cash flow story continues to hold.
Compared with the wider telecom group, paying 22.8x earnings versus 16.6x for the sector and 19.5x for peers is a clear step up. The fair P/E ratio of 9.6x is far lower again, which sets out a level the market could move towards if sentiment or expectations reset around more conservative profit assumptions.
Result: Price-to-earnings of 22.8x (OVERVALUED)
However, there are clear risks for Anterix if earnings expectations reset or if revenue growth at $6.501m does not support its current P/E premium and $2.05b market value.
Another view on Anterix’s value using our DCF model
The P/E points to Anterix looking expensive, but our DCF model tells a different story. On that basis, the stock at $106.04 is trading about 17.1% below an estimated future cash flow value of $127.90, suggesting the market might be more cautious about cash flows than this model implies.
For investors weighing these two signals, the gap between an earnings based premium and a DCF based discount raises a simple question: which set of assumptions feels more realistic for how Anterix’s spectrum assets will be monetised over time?
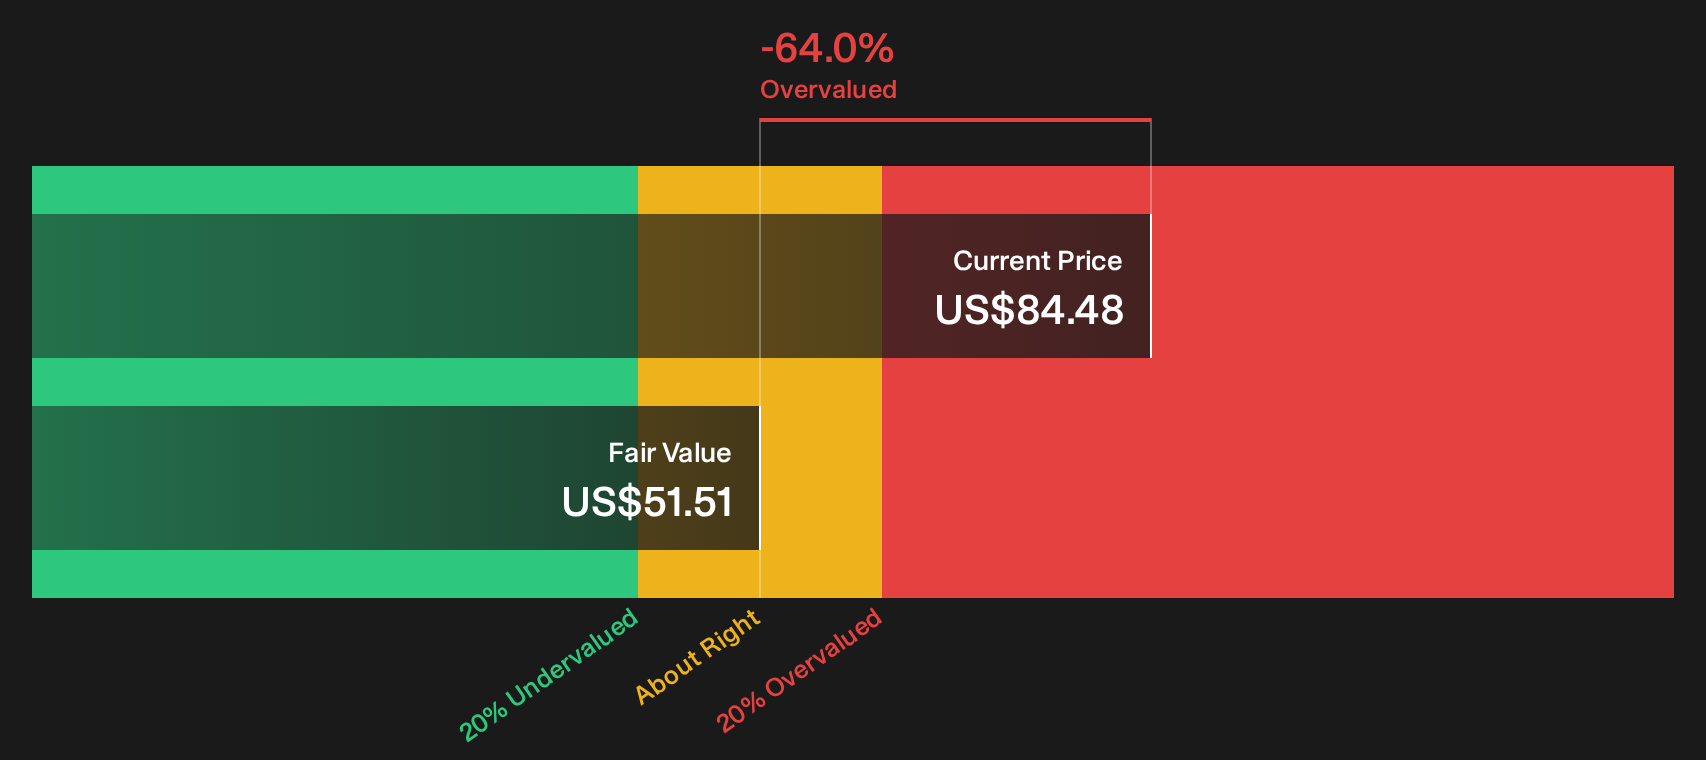
Simply Wall St performs a discounted cash flow (DCF) on every stock in the world every day (check out Anterix for example). We show the entire calculation in full. You can track the result in your watchlist or portfolio and be alerted when this changes, or use our stock screener to discover 41 high quality undervalued stocks. If you save a screener we even alert you when new companies match - so you never miss a potential opportunity.
Next Steps
With Anterix showing both strong momentum and mixed valuation signals, do you see more risk or reward here, and how soon do you want to decide? Take a closer look at the balance of concerns and potential upside by reviewing the 3 key rewards and 3 important warning signs.
Looking for more investment ideas beyond Anterix?
If Anterix has sharpened your interest, now is the time to broaden your watchlist so you are not relying on a single story for potential returns.
- Scan for quality at a discount by checking out the 41 high quality undervalued stocks before those opportunities become widely followed.
- Strengthen your income stream by reviewing the 8 dividend fortresses while yields and fundamentals still look appealing.
- Reduce portfolio shocks by assessing the 74 resilient stocks with low risk scores so potential steadier holdings do not slip past you unnoticed.
This article by Simply Wall St is general in nature. We provide commentary based on historical data and analyst forecasts only using an unbiased methodology and our articles are not intended to be financial advice. It does not constitute a recommendation to buy or sell any stock, and does not take account of your objectives, or your financial situation. We aim to bring you long-term focused analysis driven by fundamental data. Note that our analysis may not factor in the latest price-sensitive company announcements or qualitative material. Simply Wall St has no position in any stocks mentioned.