

Apollo Global Management (APO) Could Be 16% Below Fair Value As AI Push Builds
Apollo Global Management Inc APO | 0.00 |
Apollo Global Management (APO) is back in focus after joining a planned $500b funding initiative for AI infrastructure alongside partners such as Nvidia and Blackstone, while also building a new technology focused hub in Austin, Texas.
Against this backdrop, Apollo Global Management’s shares trade at US$132.02, with a 1 month share price return of 9.71% and a year to date share price decline of 9.95%. The 5 year total shareholder return of 145.72% points to stronger longer term momentum.
If the AI build out theme has your attention, it could be a good moment to see what else is moving in this space through the 56 AI infrastructure stocks
The recent rebound in Apollo Global Management sits between two stories. One points to stronger interest in its AI and Austin moves; the other to a shift in sentiment after a weaker year to date. How does that compare with the current valuation?
Preferred P/E of 40.3x: Is it justified?
Apollo Global Management currently trades on a P/E of 40.3x, which sits below peers on the same metric but above both its industry and a fair value benchmark.
The P/E ratio compares the share price to earnings per share. For an asset manager like Apollo Global Management, this gives you a quick sense of how much investors are willing to pay for each dollar of earnings given its mix of asset management, retirement services and principal investing income.
On one hand, Apollo Global Management is described as good value against a peer average P/E of 48.3x, suggesting investors are paying less for each dollar of earnings than for similar companies. On the other hand, the same 40.3x multiple is higher than the US Diversified Financial industry average of 16.1x and also above an estimated fair P/E of 26.8x, which points to a level the market could move towards if expectations cool.
Result: Price-to-earnings of 40.3x (OVERVALUED)
However, Apollo Global Management still faces risks if AI infrastructure funding slows or if sentiment toward diversified financial stocks weakens after the recent share price rebound.
Another view on Apollo Global Management valuation
While the 40.3x P/E for Apollo Global Management appears expensive compared with the industry and a fair ratio of 26.8x, the SWS DCF model suggests a different picture. At $132.02 the stock sits about 15.7% below an estimated future cash flow value of $156.59. Which signal do you trust more when expectations shift?
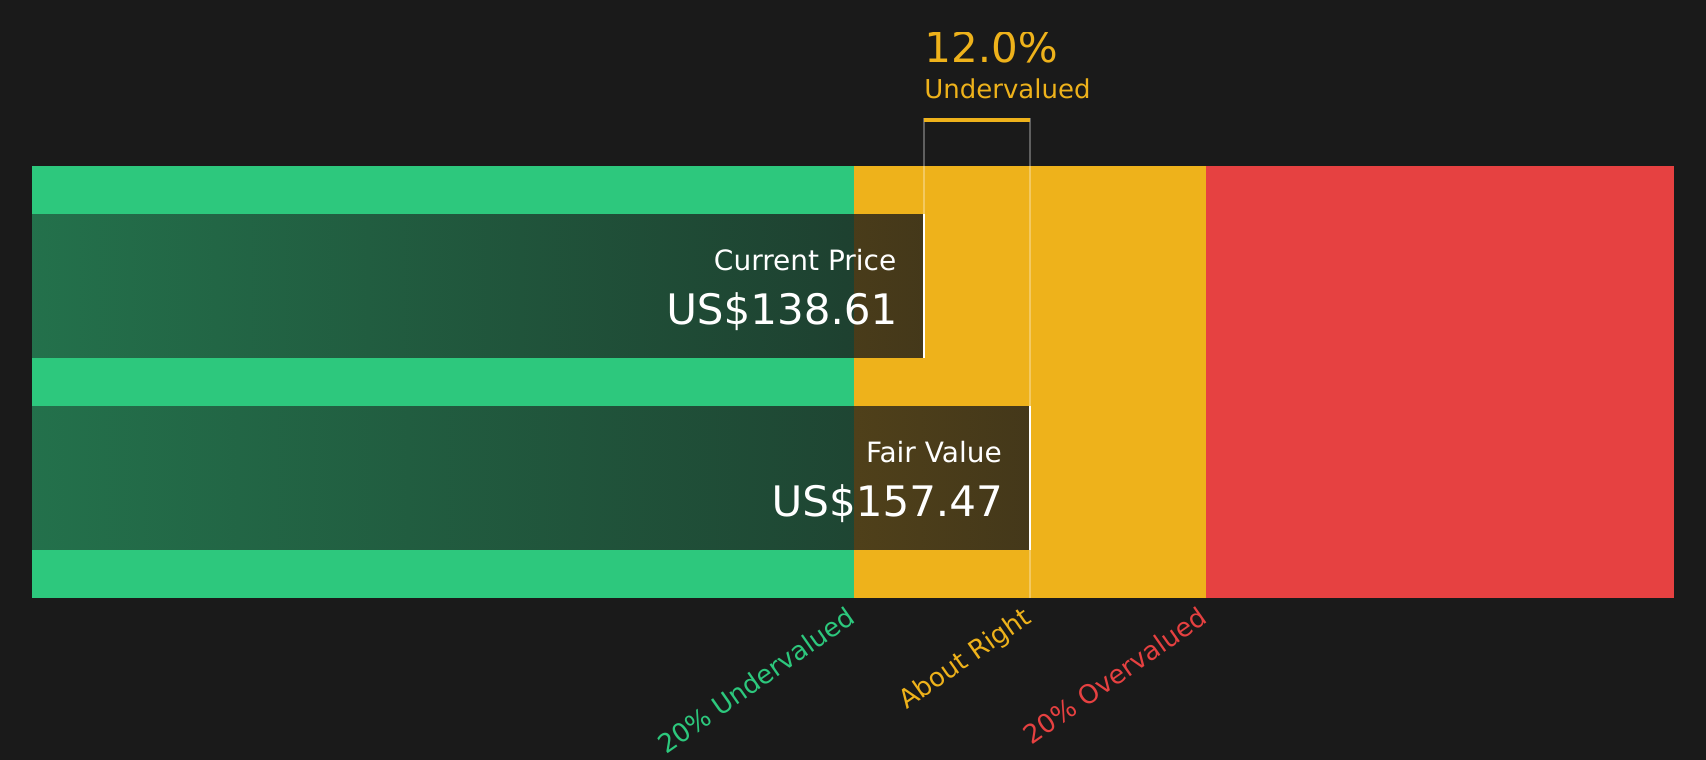
Simply Wall St performs a discounted cash flow (DCF) on every stock in the world every day (check out Apollo Global Management for example). We show the entire calculation in full. You can track the result in your watchlist or portfolio and be alerted when this changes, or use our stock screener to discover 51 high quality undervalued stocks. If you save a screener we even alert you when new companies match - so you never miss a potential opportunity.
Next Steps
With Apollo Global Management pulling attention in both directions, it makes sense to move fast and look through the details yourself before sentiment shifts again. To see how the balance of concern and optimism stacks up, review the 2 key rewards and 3 important warning signs
Looking for more investment ideas beyond Apollo Global Management?
If Apollo Global Management has sharpened your focus on opportunities, do not stop here. Use the screener to compare other stocks, refine your watchlist, and keep your edge.
- Target potential mispricings by scanning companies that appear to trade below their fundamentals through the 51 high quality undervalued stocks.
- Strengthen your income stream by checking out stocks highlighted as potential yield anchors using the 9 dividend fortresses.
- Prioritise resilience by reviewing companies flagged for sturdier financial foundations with the solid balance sheet and fundamentals stocks screener (48 results).
This article by Simply Wall St is general in nature. We provide commentary based on historical data and analyst forecasts only using an unbiased methodology and our articles are not intended to be financial advice. It does not constitute a recommendation to buy or sell any stock, and does not take account of your objectives, or your financial situation. We aim to bring you long-term focused analysis driven by fundamental data. Note that our analysis may not factor in the latest price-sensitive company announcements or qualitative material. Simply Wall St has no position in any stocks mentioned.