

Applied Aerospace & Defense (AADX) Following Record Results And 2026 Guidance Looks Fairly Priced
Applied Aerospace & Defense, Inc. AADX | 0.00 |
Applied Aerospace & Defense (AADX) shares were in focus after the company issued full year 2026 revenue guidance of US$670 million to US$690 million, alongside record second quarter results and a growing contract backlog.
Applied Aerospace & Defense’s recent guidance and record quarter came alongside a share price of US$19.11, with the stock falling 7.19% on a 1 day share price return and 9.94% on a 7 day share price return, while the 30 day share price return of 2.08% and year to date share price return of 0.53% point to only modest momentum so far.
If you are watching how defense and space programs are reshaping opportunities, it can be useful to widen the lens and scan 39 robotics and automation stocks
After Applied Aerospace & Defense slid despite record results and guidance, the stock now sits at about a 32% discount to analyst targets and a smaller modeled fair value gap. Is that caution sensible, or an opportunity mispriced?
Price to Sales of 6.2x: Is it justified?
On the latest numbers, Applied Aerospace & Defense trades on a P/S of 6.2x, which screens as good value against its peer group average of 11x, but sits above the broader US aerospace and defense P/S of 5x. That mix of signals helps explain why some investors see room for upside while others are more cautious at the current $19.11 share price.
The P/S multiple compares the company’s market value to its revenue, so it is useful when a business like Applied Aerospace & Defense is still loss making. With revenue of $522.09m and the stock valued at about $3.52b, the current 6.2x P/S suggests the market is already assigning a premium to each dollar of sales.
Compared with closer peers on 11x, the stock trades at a material discount, which points to a lower revenue multiple than similar companies. Set that against the wider US aerospace and defense group on 5x, and the 6.2x level starts to look fuller. The split view hints that investors are paying more than the sector average for Applied Aerospace & Defense’s revenue while still pricing it below tighter peer sets.
Result: Price-to-Sales of 6.2x (ABOUT RIGHT)
However, Applied Aerospace & Defense still carries risks, including ongoing net losses of US$24.843m and reliance on continued contract flow from defense and space programs.
Another view on Applied Aerospace & Defense’s value
The SWS DCF model points to a fair value of about $21.14 per share for Applied Aerospace & Defense, compared with the current $19.11 price. That is roughly a 9.6% gap. So while the P/S looks about right, the cash flow view suggests some upside potential. Which lens do you trust more?
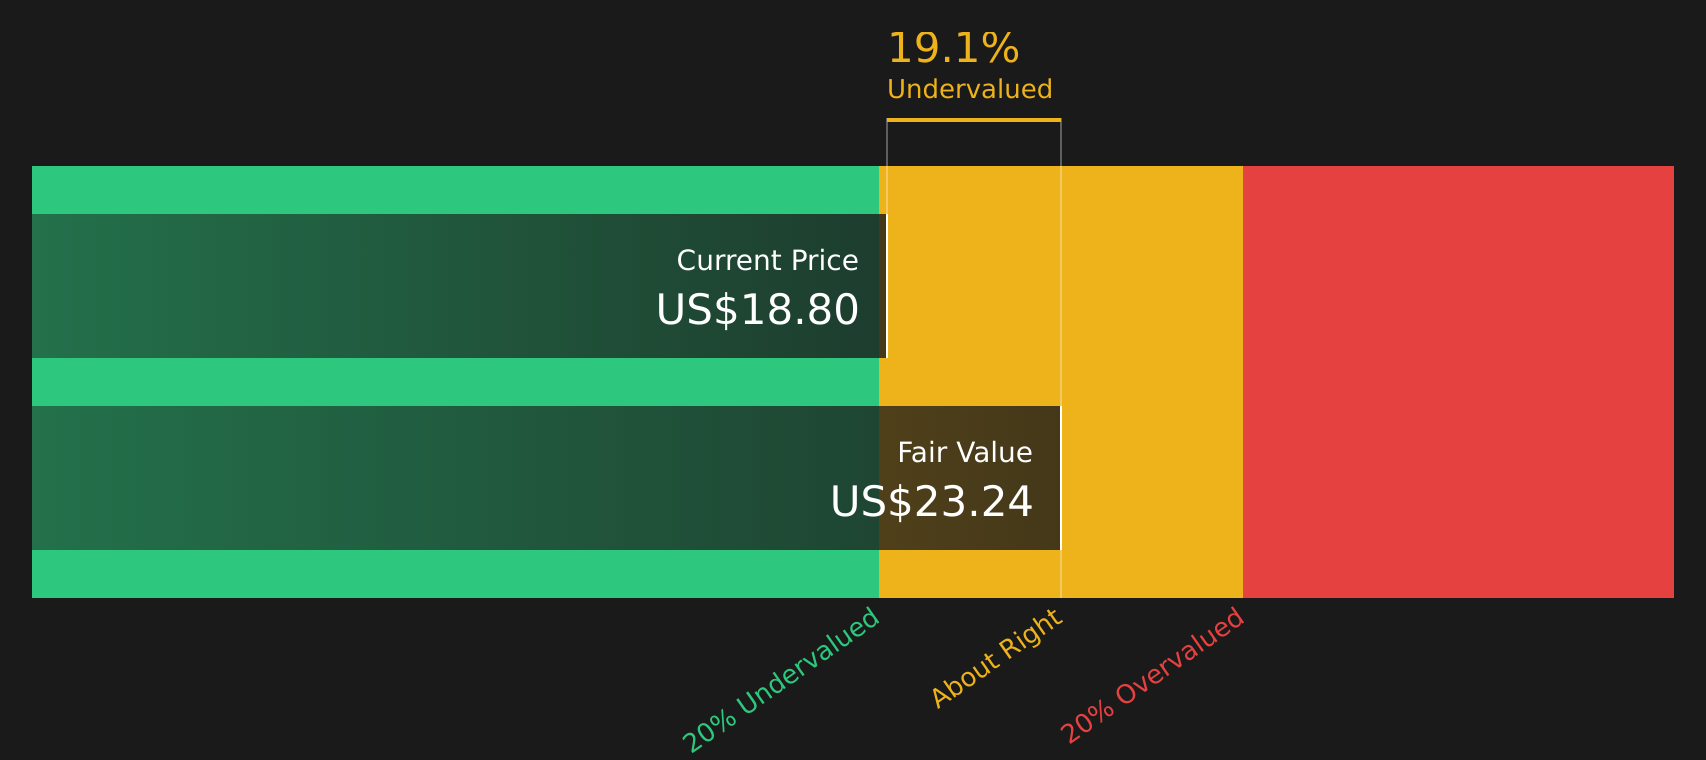
Simply Wall St performs a discounted cash flow (DCF) on every stock in the world every day (check out Applied Aerospace & Defense for example). We show the entire calculation in full. You can track the result in your watchlist or portfolio and be alerted when this changes, or use our stock screener to discover 49 high quality undervalued stocks. If you save a screener we even alert you when new companies match - so you never miss a potential opportunity.
Next Steps
The mix of cautious pricing signals and pockets of optimism around Applied Aerospace & Defense can feel finely balanced. Act while the data is fresh and form your own view using our breakdown of 4 key rewards and 2 important warning signs
Looking for more investment ideas beyond Applied Aerospace & Defense?
If Applied Aerospace & Defense has sharpened your focus, do not stop here. The right mix of quality, value and resilience often sits just outside the obvious shortlist.
- Target resilient compounding by scanning 85 resilient stocks with low risk scores that aim to keep volatility in check while still offering room for growth.
- Hunt for potential bargains early by reviewing screener containing 20 high quality undiscovered gems that combine solid fundamentals with lower market attention.
- Strengthen your core holdings by filtering for companies in the solid balance sheet and fundamentals stocks screener (49 results) that can better handle shocks and funding needs.
This article by Simply Wall St is general in nature. We provide commentary based on historical data and analyst forecasts only using an unbiased methodology and our articles are not intended to be financial advice. It does not constitute a recommendation to buy or sell any stock, and does not take account of your objectives, or your financial situation. We aim to bring you long-term focused analysis driven by fundamental data. Note that our analysis may not factor in the latest price-sensitive company announcements or qualitative material. Simply Wall St has no position in any stocks mentioned.