Array Digital Infrastructure (AD) Valuation Check After US$1.17b Spectrum Sales And Special Dividend
Array Digital Infrastructure, Inc. AD | 0.00 |
Special dividend and spectrum sales set the stage
Array Digital Infrastructure (AD) has drawn fresh attention after selling spectrum assets to Verizon and T-Mobile for a combined US$1.17b and declaring a one time US$11.00 per share special cash dividend.
The recent spectrum disposals and special dividend have arrived while the stock shows mixed momentum, with a 7.05% 1 month share price return and a modest 5.51% 3 month share price return. However, a very large 3 year total shareholder return signals a powerful longer term payoff story.
If you are curious how other telecom and data infrastructure stocks are trading around big capital return announcements, it is worth scanning 48 AI infrastructure stocks
With Array Digital Infrastructure now trading close to its analyst price target after a very large 3 year total return, you have to ask whether the recent spectrum windfall leaves the stock undervalued or if the market already assumes more growth ahead.
Most Popular Narrative: 2.2% Undervalued
Array Digital Infrastructure's most followed valuation narrative pegs fair value at $53.83 per share, just above the last close of $52.66. This keeps the focus squarely on the assumptions behind that small gap rather than a big discount.
The anticipated mid-2025 closing of the transaction with T-Mobile, subject to regulatory approval, is expected to provide UScellular with significant proceeds, which could impact earnings positively by paying down debt and potentially declaring special dividends. The expansion of UScellular's fiber program, having already expanded its footprint by 30% in the last three years, presents opportunities for future revenue growth as more addresses are delivered and internet penetration increases.
The fair value story here leans heavily on how those transaction proceeds, future tower and fiber revenue, and slimmer profit margins are expected to interact over several years. Want to see how those moving parts are stitched together into one price tag?
Result: Fair Value of $53.83 (UNDERVALUED)
However, the whole story could look very different if regulators slow or block the T Mobile deal, or if competitive pressure continues to squeeze service revenues and margins.
Another View: Earnings Power Versus Price Tag
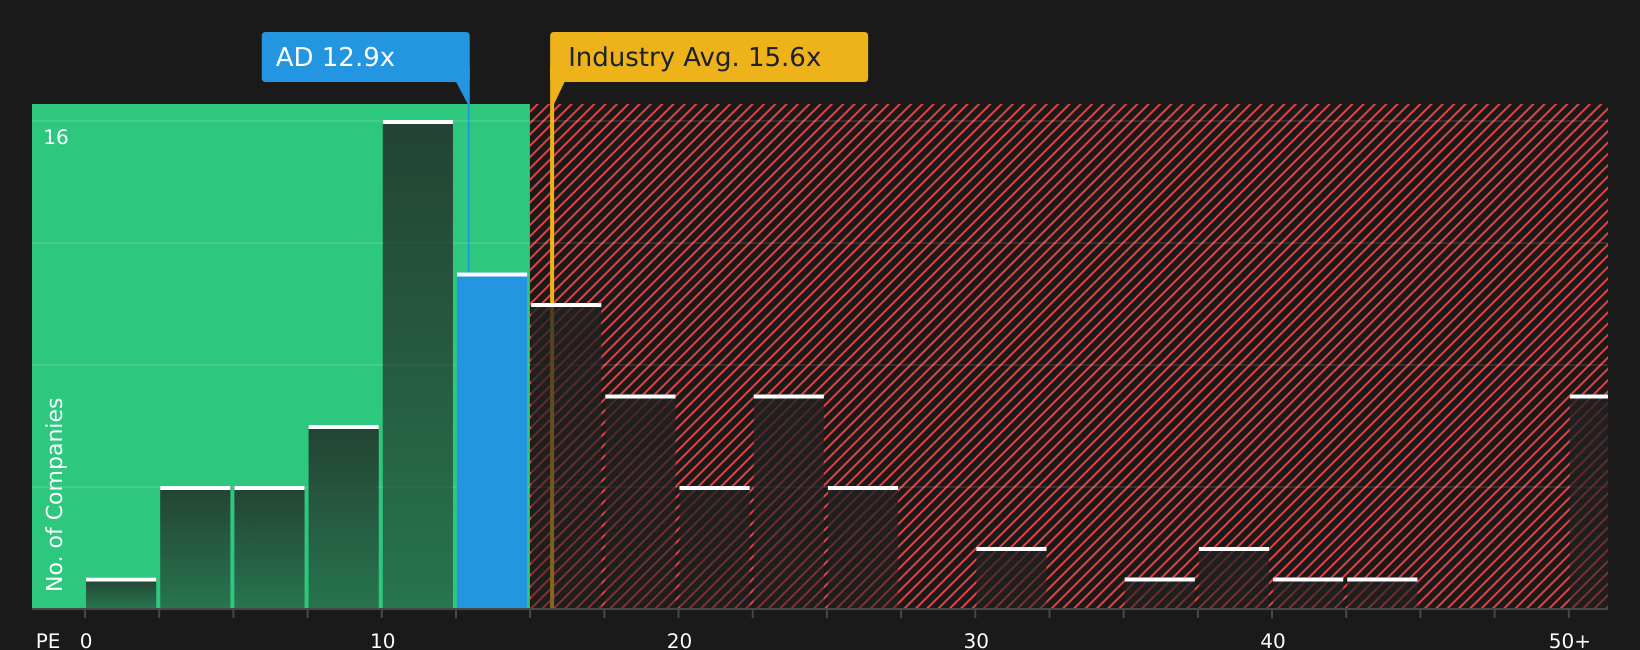
That 2.2% gap between price and the $53.83 fair value is built on long term earnings forecasts and high future P/E assumptions. The current P/E of 13.2x tells a different story, sitting below the US market at 18.8x and the global wireless telecom average at 15.2x, yet above the fair ratio of 8.5x that the market could move toward. For you, that mix of relative cheapness to peers and a premium to the fair ratio raises a simple question: is this a margin of safety or a valuation risk if sentiment cools?
Before leaning too hard on any single number, it is worth stress testing those earnings multiples against other companies with similar profiles, then asking whether the current premium to the fair ratio looks justified or fragile. See what the numbers say about this price — find out in our valuation breakdown.
Next Steps
If the mixed signals in this article leave you on the fence, check the numbers yourself and move quickly to shape your own view with 2 key rewards and 2 important warning signs
Looking for more investment ideas?
Do not stop with one stock when you can compare several strong candidates side by side and quickly spot opportunities that match your risk and income needs.
- Target resilient balance sheets by scanning the solid balance sheet and fundamentals stocks screener (47 results) and focus on companies with support for potential shocks.
- Pursue income-focused opportunities through the 11 dividend fortresses and see which stocks currently offer higher yields with supporting fundamentals.
- Hunt for under-the-radar potential using the screener containing 22 high quality undiscovered gems so you are not the last to find companies with solid metrics.
This article by Simply Wall St is general in nature. We provide commentary based on historical data and analyst forecasts only using an unbiased methodology and our articles are not intended to be financial advice. It does not constitute a recommendation to buy or sell any stock, and does not take account of your objectives, or your financial situation. We aim to bring you long-term focused analysis driven by fundamental data. Note that our analysis may not factor in the latest price-sensitive company announcements or qualitative material. Simply Wall St has no position in any stocks mentioned.