

Ashland (ASH) Joins Russell 2000 Indices, Is It Still Undervalued?
Ashland Inc. ASH | 0.00 |
What Ashland’s index reshuffle means for investors
Ashland (ASH) is moving out of several Russell 1000 and midcap indices and into a suite of Russell 2000, value, and defensive benchmarks, a reshuffle that can influence index fund trading and liquidity.
These index changes often prompt mechanical buying and selling from funds that track the affected benchmarks, which can temporarily affect trading volumes around the implementation date without necessarily changing the underlying business outlook.
Over the past year Ashland’s share price has shown improving momentum, with a 15.21% 90 day share price return and an 8.60% year to date share price return. The 1 year total shareholder return of 22.87% contrasts with weaker 3 and 5 year total shareholder returns, suggesting sentiment has only recently improved around events like this index reshuffle.
If this index move has you rethinking where opportunities might lie, it could be a good time to scan other specialty and materials related plays using the 18 top founder-led companies
Ashland now trades around US$65, with analyst targets near US$69 and an estimated intrinsic value that sits meaningfully higher. How wide is this gap in practice, and what does it say about fair value today?
Most Popular Narrative: 3.4% Undervalued
On the latest numbers, Ashland is trading at $65 while the most followed narrative pegs fair value closer to $67, a small gap that still rests on detailed long term assumptions.
The global shift toward sustainable and bio-based materials, driven by regulatory requirements and consumer preference, continues to gain momentum, benefiting Ashland's specialty chemicals portfolio that is now more focused on high-value, sustainable, and compliant solutions; this is expected to support top-line revenue growth and margin resilience over the long term.
Want to see how that sustainability push, future revenue path and the margin rebuild all feed into Ashland's fair value story? The narrative rests on a specific mix of top line growth, a turn from losses to profits and a valuation multiple that contrasts with the wider chemicals sector. The interesting part is how those moving pieces fit together and what has to go right for the numbers to line up.
Result: Fair Value of $67.27 (UNDERVALUED)
However, Ashland's narrative still faces pressure from ongoing demand softness in Specialty Additives and from the signal sent by a US$706 million goodwill impairment about market skepticism.
Another View: Ashland’s pricing sends a different signal
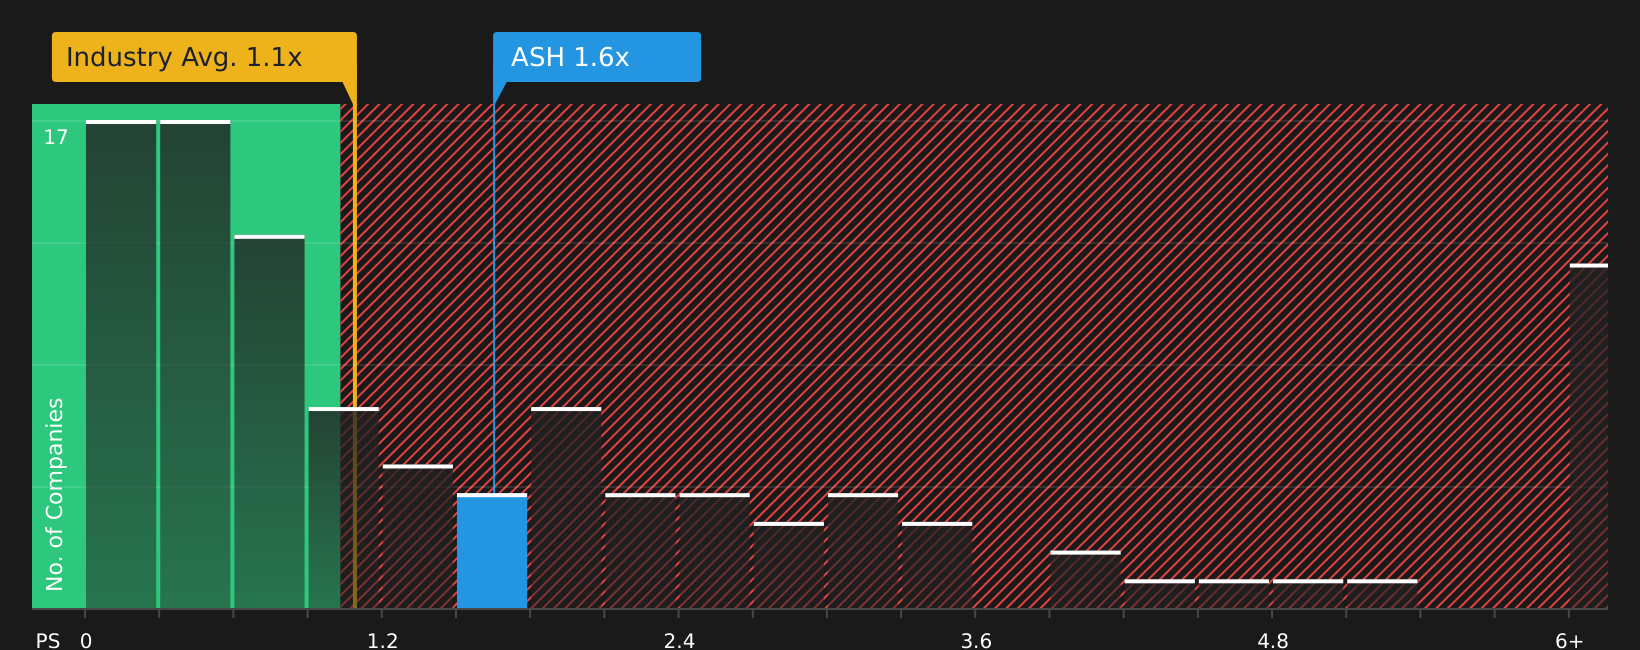
While the narrative and fair value work suggest Ashland is around 3.4% undervalued, its current P/S ratio of 1.6x sits above both the US Chemicals industry average of 1.1x and an estimated fair ratio of 1.4x. That richer pricing hints at valuation risk rather than a clear bargain. How much comfort should you really take from a small discount to fair value?
For a closer look at how this sales based comparison stacks up against peers and where the fair ratio might pull the valuation, have a look at the See what the numbers say about this price — find out in our valuation breakdown.
Next Steps
If the mixed signals around Ashland have you on the fence, take a closer look at the underlying data and weigh both sides of the story yourself using the 2 key rewards and 1 important warning sign
Looking for more Ashland investment ideas?
If Ashland has you thinking about what else might be worth your attention, do not sit on the sidelines while other opportunities pass by unnoticed.
- Spot potential bargains early by scanning companies that currently screen as 44 high quality undervalued stocks before the crowd pays attention.
- Build a sturdier core to your portfolio by hunting for companies in the solid balance sheet and fundamentals stocks screener (47 results) that may better handle shocks.
- Aim for a smoother ride by focusing on companies highlighted in the 73 resilient stocks with low risk scores when you want returns without taking on excessive volatility.
This article by Simply Wall St is general in nature. We provide commentary based on historical data and analyst forecasts only using an unbiased methodology and our articles are not intended to be financial advice. It does not constitute a recommendation to buy or sell any stock, and does not take account of your objectives, or your financial situation. We aim to bring you long-term focused analysis driven by fundamental data. Note that our analysis may not factor in the latest price-sensitive company announcements or qualitative material. Simply Wall St has no position in any stocks mentioned.