ASML Holding (NasdaqGS:ASML) Stock Looks Fully Priced After Strong Recent Gains
ASML Holding NV ADR ASML | 0.00 |
ASML Holding (NasdaqGS:ASML) stock has recently drawn attention after a series of strong trailing returns, with the shares up 3.5% in the past day and 7.7% over the past week.
At a share price of $1,867.83, ASML Holding sits on strong recent momentum, with a 30 day share price return of 26.86% and a 1 year total shareholder return of 146.87%. This suggests investors have recently been willing to pay more for its earnings and growth profile.
If you are looking for other opportunities in related areas of the market, this could be a good moment to scan focused lists of 49 AI infrastructure stocks
With ASML Holding now trading above the average analyst price target and recent returns already very strong, the key question is whether the current valuation still leaves room for upside or if markets are already pricing in future growth.
Preferred P/E of 63.7x: Is it justified?
ASML Holding stock is currently trading on a P/E of 63.7x, which sits slightly below both its peer group and the wider US Semiconductor industry averages.
The P/E ratio compares the company’s share price to its earnings per share and is a common way investors weigh what they are paying for each dollar of profit. For a business like ASML Holding that serves as a key supplier to chipmakers, this ratio can capture how the market is factoring in its earnings quality and expectations for future profits.
Right now, ASML Holding’s P/E of 63.7x is lower than the peer average of 66.7x and the US Semiconductor industry average of 68.3x, which implies the stock is priced at a small discount to many comparable semiconductor companies. However, this is still above the estimated fair P/E of 52.7x. The market could move closer to that level if expectations around growth or profitability moderate from current levels.
Result: Price-to-Earnings of 63.7x (ABOUT RIGHT)
However, ASML Holding’s rich P/E and very strong recent share price returns could leave the stock vulnerable if sector demand shifts or large customers adjust spending plans.
Another view on ASML Holding valuation
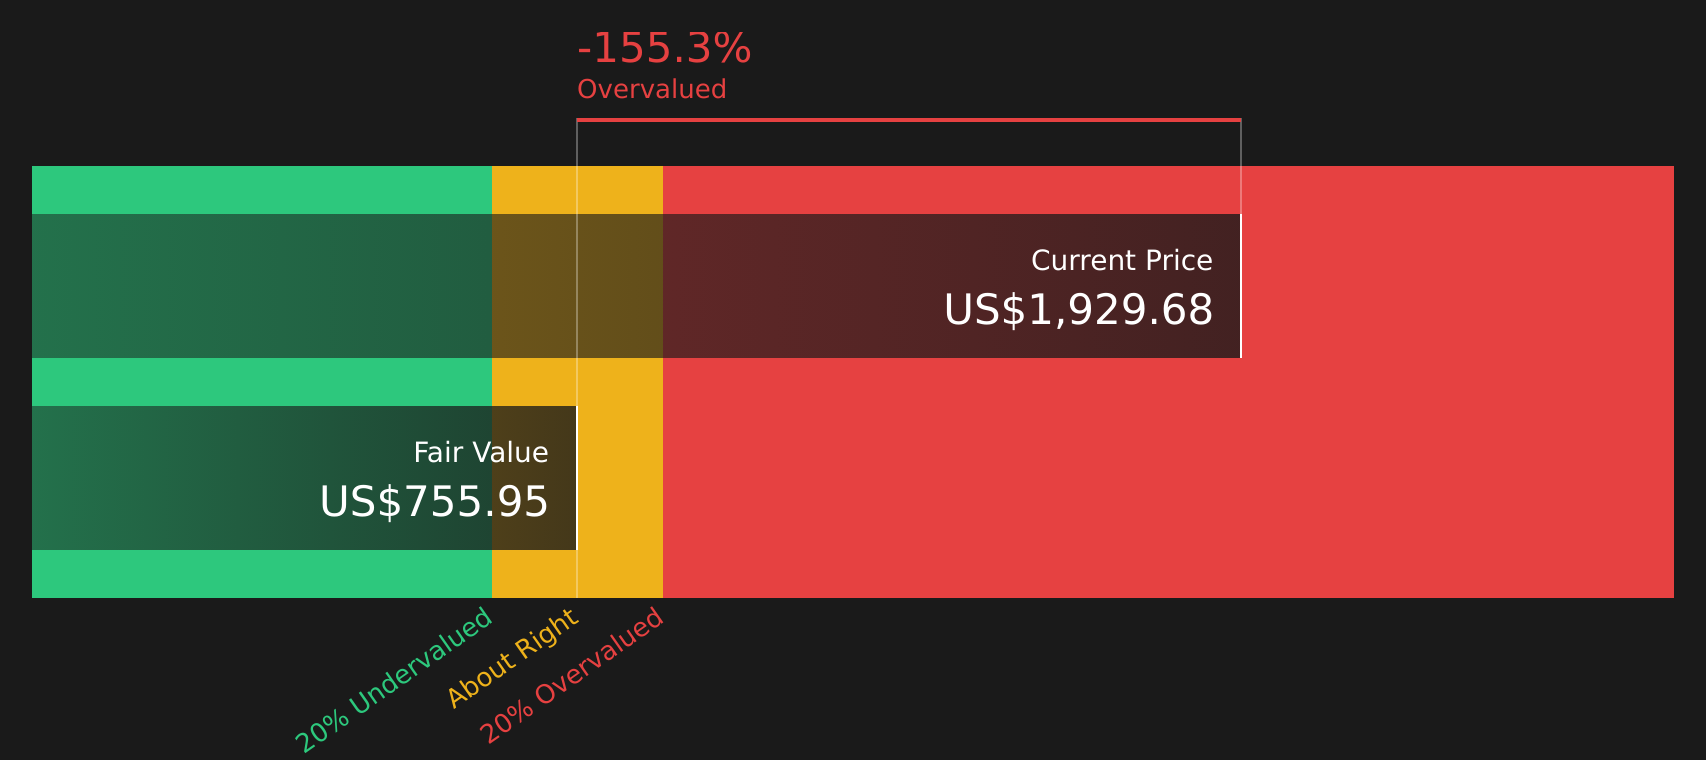
While ASML Holding looks slightly cheaper than peers on its 63.7x P/E, the SWS DCF model paints a different picture, with an estimated future cash flow value of $740.38 per share versus the current $1,867.83. That gap points to valuation risk rather than a discount, so which signal should you put more weight on?
Simply Wall St performs a discounted cash flow (DCF) on every stock in the world every day (check out ASML Holding for example). We show the entire calculation in full. You can track the result in your watchlist or portfolio and be alerted when this changes, or use our stock screener to discover 48 high quality undervalued stocks. If you save a screener we even alert you when new companies match - so you never miss a potential opportunity.
Next Steps
If this mix of strong recent returns and valuation questions has you thinking hard about ASML Holding, take a moment to review the data and decide how comfortable you are with the current pricing. Then consider what the upside factors might be by checking the 3 key rewards.
Looking for more investment ideas beyond ASML Holding?
Do not stop with ASML Holding. Use this moment of momentum to broaden your watchlist with other focused ideas that could fit your style and risk comfort.
- Target potential upside by scanning companies that look attractively priced on fundamentals through the 48 high quality undervalued stocks.
- Strengthen your income stream by searching for reliable payers using the 8 dividend fortresses.
- Reduce portfolio stress by focusing on businesses with steadier profiles via the 65 resilient stocks with low risk scores.
This article by Simply Wall St is general in nature. We provide commentary based on historical data and analyst forecasts only using an unbiased methodology and our articles are not intended to be financial advice. It does not constitute a recommendation to buy or sell any stock, and does not take account of your objectives, or your financial situation. We aim to bring you long-term focused analysis driven by fundamental data. Note that our analysis may not factor in the latest price-sensitive company announcements or qualitative material. Simply Wall St has no position in any stocks mentioned.