Assessing American Superconductor (AMSC) Valuation After Earnings Beat And Upgraded Guidance
American Superconductor Corporation AMSC | 32.09 | -1.72% |
American Superconductor (AMSC) is back in focus after reporting Q3 results that exceeded expectations, highlighting higher sales, sharply stronger net income, and management commentary pointing to momentum across energy, data center, and military markets.
The latest results and guidance arrived after a strong run in the share price, with a 24.09% 7 day share price return and a 12.88% 1 year total shareholder return, suggesting momentum has been building rather than fading.
If this earnings move has you looking beyond a single name, it could be a good moment to scan our list of 25 power grid technology and infrastructure stocks as potential next ideas.
With Q3 earnings well ahead of expectations, a fresh revenue outlook above US$80 million for Q4, and shares already up strongly, the key question is simple: is American Superconductor still mispriced, or is the market already banking on future growth?
Most Popular Narrative: 43.8% Undervalued
At a last close of $34.26 against a narrative fair value of $61.00, the current price sits well below what this widely followed framework suggests, putting the focus firmly on how that gap is justified by the underlying growth and margin story.
High factory utilization and capacity expansion plans, combined with operational leverage from past and potential acquisitions, are driving improved efficiency and margin profile, with the potential for further net income growth as scale increases.
Want to see what is baked into that fair value jump? The narrative leans heavily on rising revenue, fatter margins, and a richer earnings multiple. Curious which assumptions really move the needle here? The full breakdown lays out the exact growth, profitability, and valuation bridge behind that $61.00 figure.
Result: Fair Value of $61 (UNDERVALUED)
However, this depends on semiconductor and data center demand holding up, as well as acquisitions and higher R&D and SG&A actually paying off rather than squeezing margins.
Another View: Cash Flows Tell a Different Story
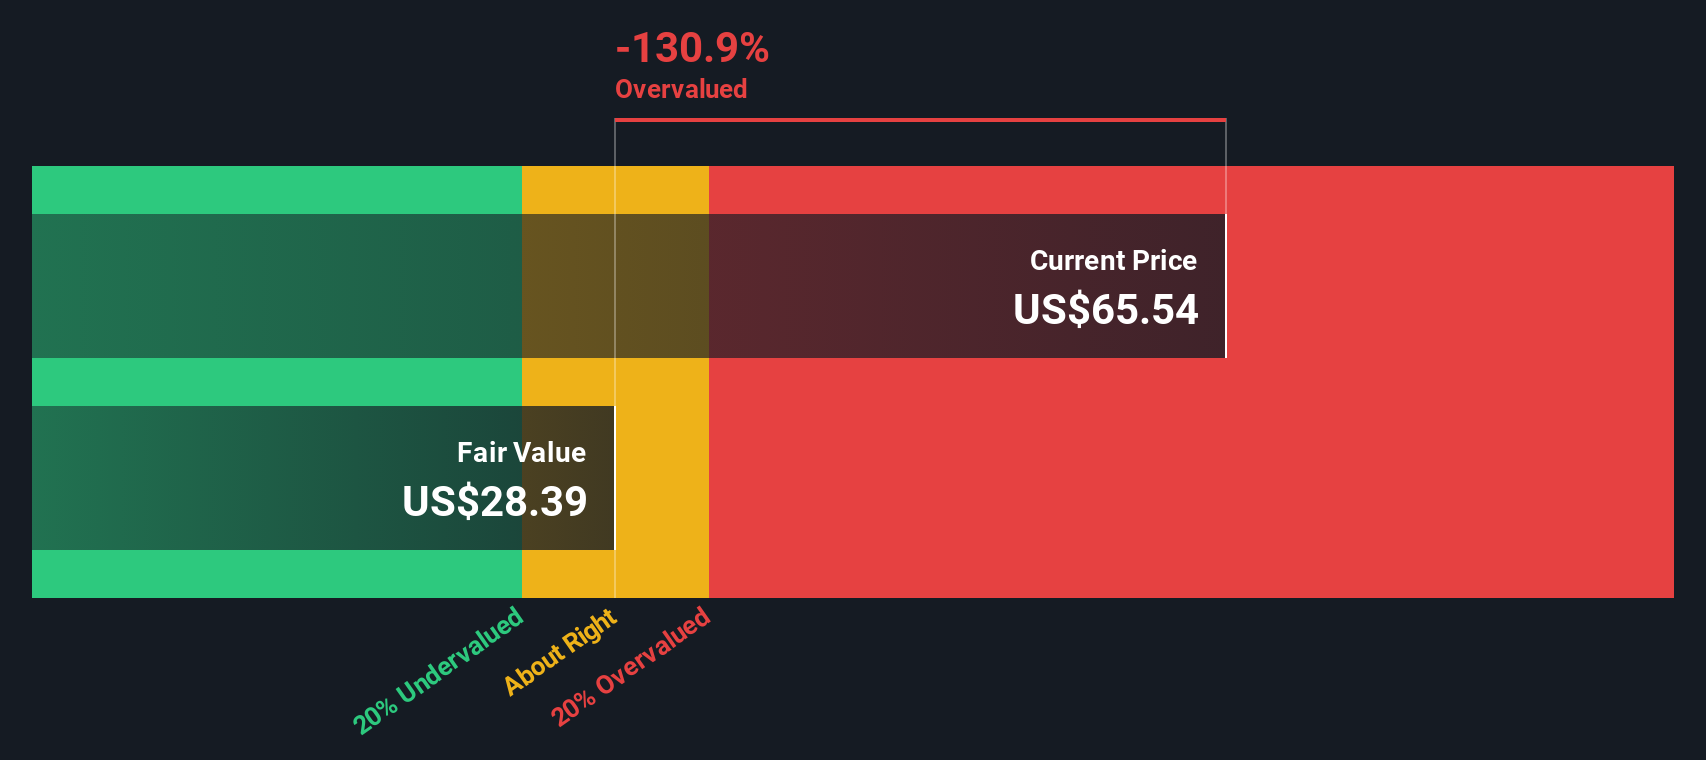
While the narrative fair value pins American Superconductor at $61 with an undervalued label, our DCF model is more cautious, with a future cash flow value of $15.46 against a $34.26 share price. This difference signals potential overvaluation instead. Which set of assumptions do you trust more: earnings or cash flows?
Simply Wall St performs a discounted cash flow (DCF) on every stock in the world every day (check out American Superconductor for example). We show the entire calculation in full. You can track the result in your watchlist or portfolio and be alerted when this changes, or use our stock screener to discover 51 high quality undervalued stocks. If you save a screener we even alert you when new companies match - so you never miss a potential opportunity.
Build Your Own American Superconductor Narrative
If you are not fully on board with these assumptions or you simply prefer to stress test the numbers yourself, you can shape your own view in just a few minutes with Do it your way.
A great starting point for your American Superconductor research is our analysis highlighting 4 key rewards and 3 important warning signs that could impact your investment decision.
Looking for more investment ideas?
If American Superconductor has sharpened your focus, do not stop here. Use the Simply Wall St Screener to line up your next set of potential opportunities.
- Target consistency first by checking companies that score well in our 85 resilient stocks with low risk scores and see which names might better fit your tolerance for ups and downs.
- Hunt for quality on sale by scanning our 51 high quality undervalued stocks to spot businesses where fundamentals and price appear out of sync.
- Prioritise proven resilience by reviewing the solid balance sheet and fundamentals stocks screener (45 results) to find companies backed by stronger financial footing.
This article by Simply Wall St is general in nature. We provide commentary based on historical data and analyst forecasts only using an unbiased methodology and our articles are not intended to be financial advice. It does not constitute a recommendation to buy or sell any stock, and does not take account of your objectives, or your financial situation. We aim to bring you long-term focused analysis driven by fundamental data. Note that our analysis may not factor in the latest price-sensitive company announcements or qualitative material. Simply Wall St has no position in any stocks mentioned.