Assessing Arm Holdings (ARM) After A 1-Year 28.7% Share Price Decline
ARM Holdings PLC Sponsored ADR ARM | 149.11 | -3.84% |
- If you are wondering whether Arm Holdings' current share price lines up with its real worth, this article is built to walk you through that question step by step.
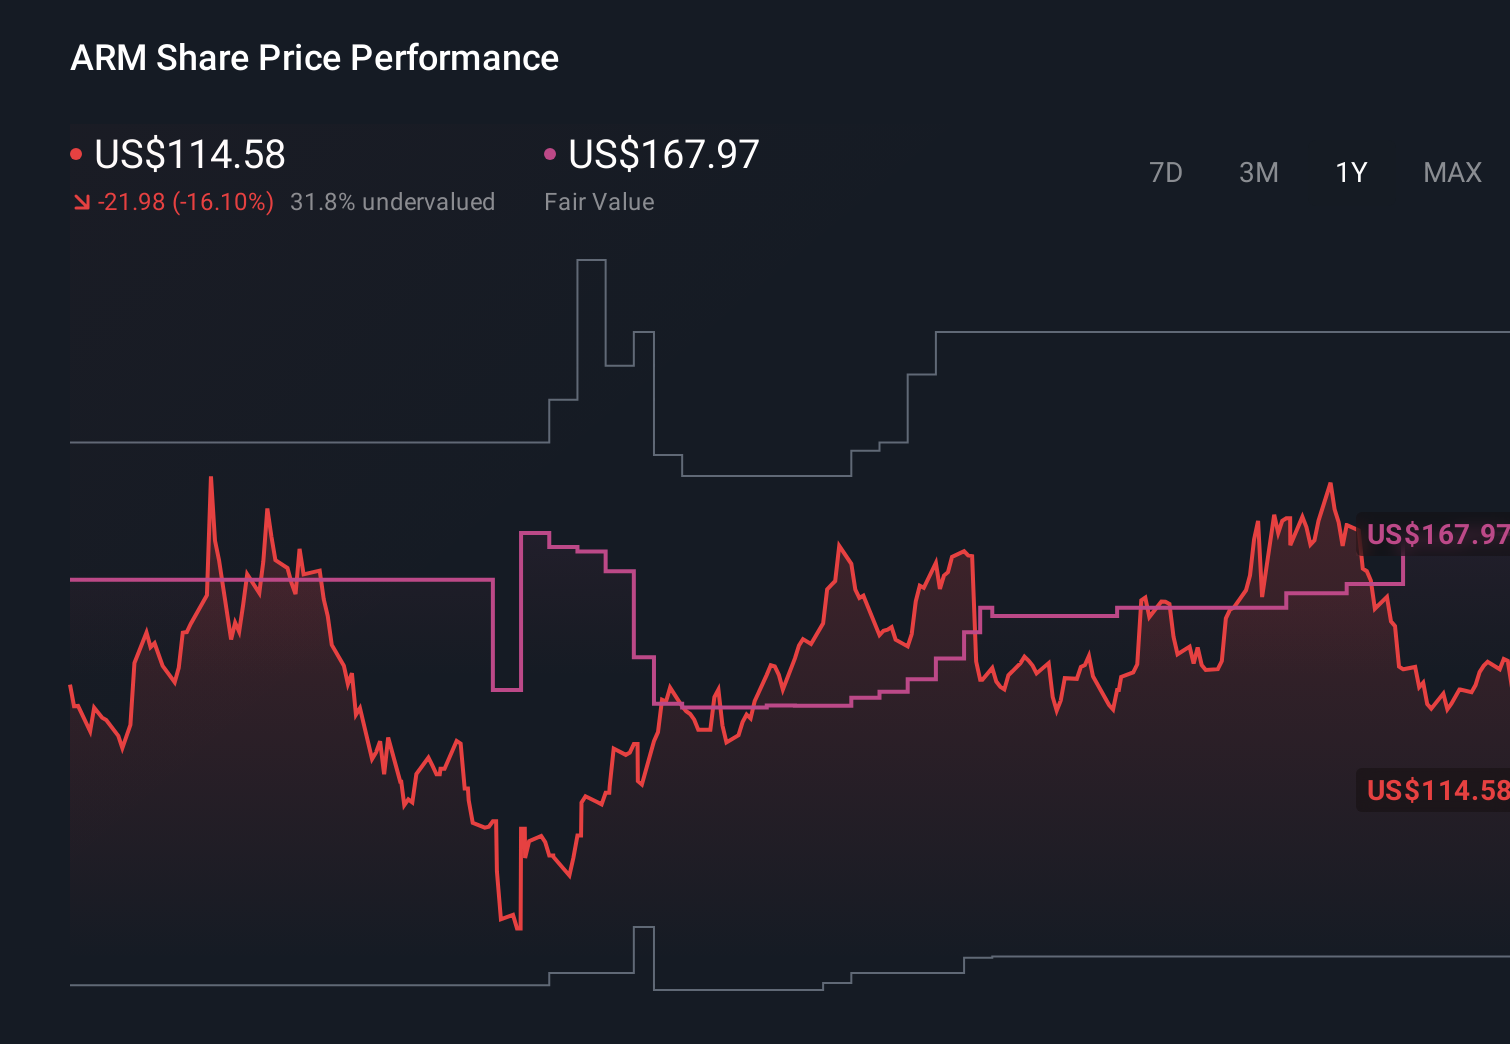
- Despite the hype around chip related names, Arm's share price closed at US$105.11, with returns of a 7% decline over 7 days, a 13.2% decline over 30 days, an 8.4% decline year to date, and a 28.7% decline over 1 year. This may change how investors think about both its growth potential and risk.
- Recent attention on Arm has largely centered on its role as a key chip architecture licensor. Investors are watching how demand for its designs connects to trends in areas like mobile devices and data centers. Broader discussion around semiconductor valuations has also kept Arm in the spotlight, as markets weigh how much future success is already reflected in current prices.
- Simply Wall St currently gives Arm Holdings a valuation score of 0 out of 6. Next we will break down what that means across different valuation methods, before finishing with a framework that can help you judge Arm's valuation in a more complete way.
Arm Holdings scores just 0/6 on our valuation checks. See what other red flags we found in the full valuation breakdown.
Approach 1: Arm Holdings Discounted Cash Flow (DCF) Analysis
A Discounted Cash Flow, or DCF, model estimates what a company could be worth today by projecting its future cash flows and then discounting them back to a present value.
For Arm Holdings, the model used here is a 2 Stage Free Cash Flow to Equity approach. The latest twelve month free cash flow is about US$1.29b. Analysts and internal estimates project free cash flow rising to US$5.27b by 2030, with a detailed path of annual projections between 2026 and 2035 that are discounted back to today using Simply Wall St’s assumptions.
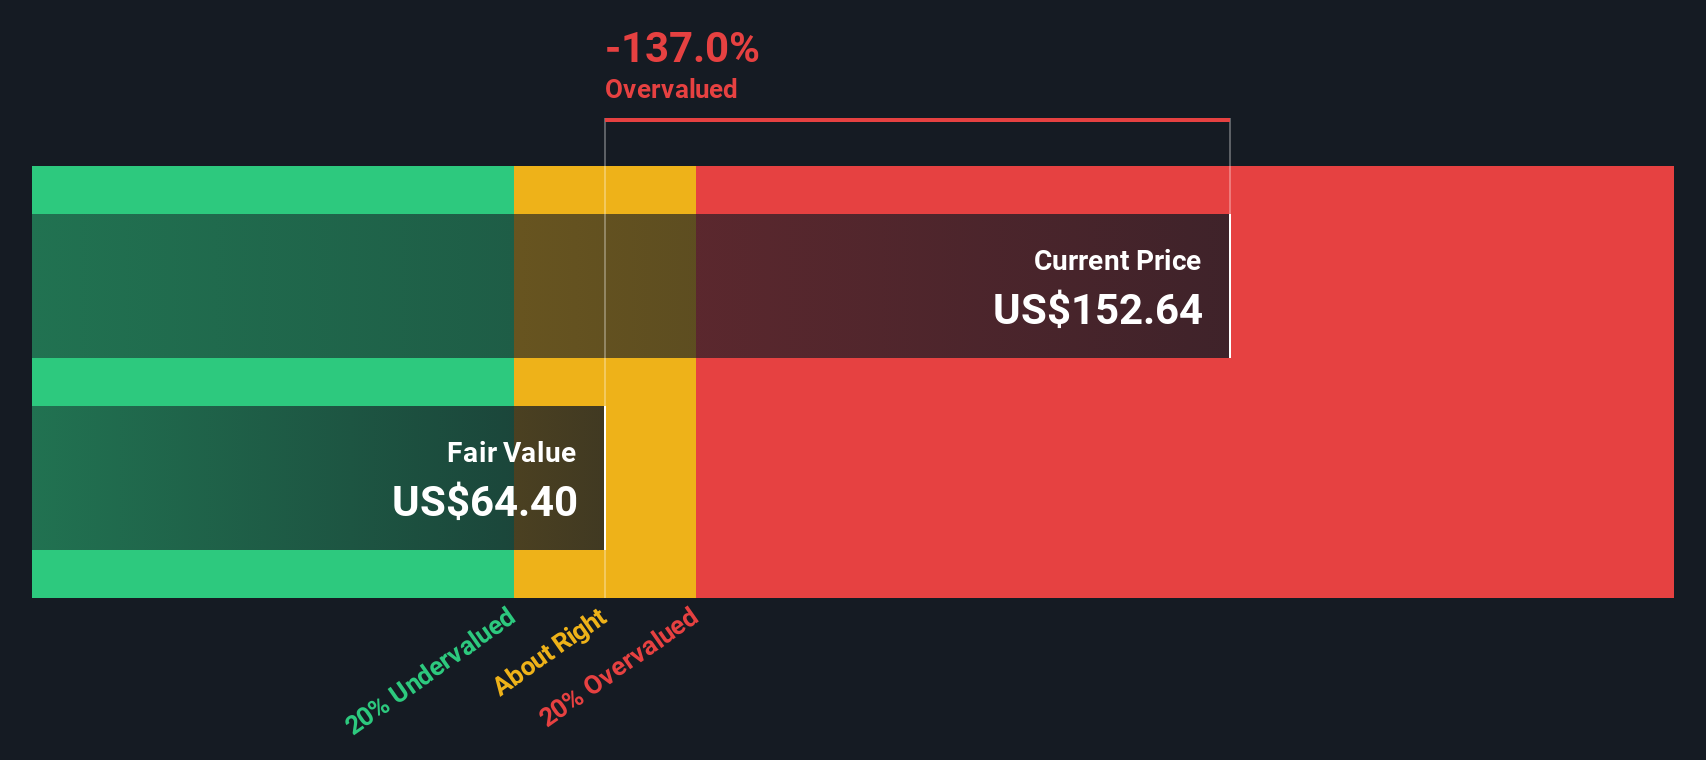
When all of those projected cash flows are combined and discounted, the model arrives at an estimated intrinsic value of US$63.49 per share. Compared with the recent share price of US$105.11, this implies the stock is around 65.5% above the DCF estimate, so on this cash flow view Arm screens as overvalued.
Result: OVERVALUED
Our Discounted Cash Flow (DCF) analysis suggests Arm Holdings may be overvalued by 65.5%. Discover 868 undervalued stocks or create your own screener to find better value opportunities.
Approach 2: Arm Holdings Price vs Earnings
For profitable companies like Arm, the P/E ratio is a useful way to think about how much you are paying for each dollar of earnings. A higher P/E usually reflects higher expected growth or lower perceived risk, while a lower P/E can reflect lower growth expectations or higher risk.
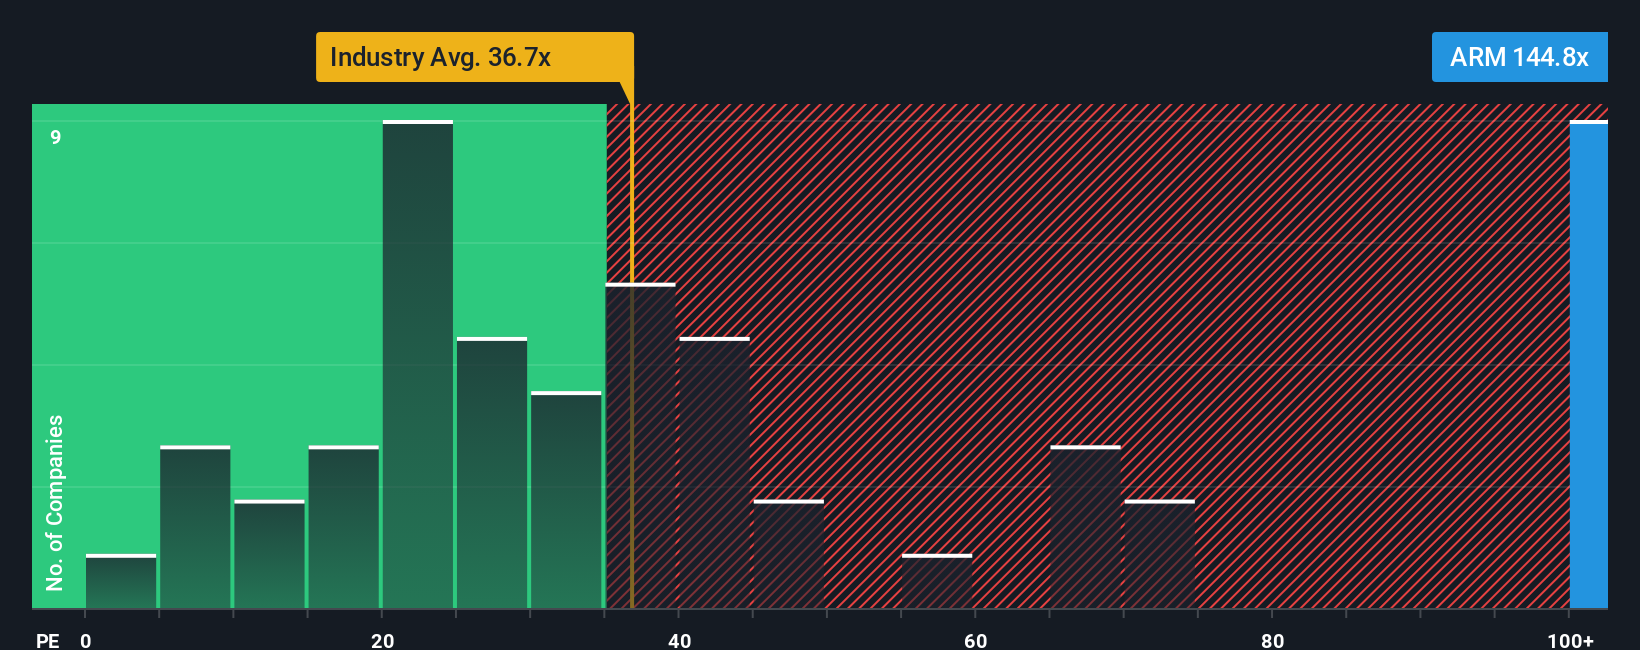
Arm currently trades on a P/E of 134.36x. That sits well above the Semiconductor industry average of 42.57x and also above the peer average of 39.50x, so the market is asking you to pay a much richer price for Arm’s earnings than for many other chip related names.
Simply Wall St’s “Fair Ratio” is designed to go a step further than simple peer or industry comparisons. It estimates what a more suitable P/E might be by factoring in elements such as Arm’s earnings growth profile, profit margins, industry, market cap and key risks. For Arm, this Fair Ratio is 51.17x, which is meaningfully lower than the current 134.36x. On this metric, the stock screens as expensive relative to what the model suggests is a more balanced multiple.
Result: OVERVALUED
P/E ratios tell one story, but what if the real opportunity lies elsewhere? Discover 1440 companies where insiders are betting big on explosive growth.
Upgrade Your Decision Making: Choose your Arm Holdings Narrative
Earlier we mentioned that there is an even better way to understand valuation, so let us introduce you to Narratives, a simple way for you to write the story behind your numbers by linking your view of Arm Holdings to your own forecasts for revenue, earnings and margins, and then to a fair value estimate.
A Narrative on Simply Wall St is essentially your investment story turned into a financial forecast. You set assumptions for the business, the platform converts those into projected financials and a fair value, and you can then compare that fair value with the current share price to decide how attractive the stock looks to you.
These Narratives live inside the Community page on Simply Wall St, which is used by millions of investors. They update automatically as new information such as earnings releases or news is added, so your story stays aligned with the latest data instead of going stale on a spreadsheet.
For example, one Arm Holdings Narrative on the platform currently anchors to a fair value of US$70 per share, while another more optimistic Narrative uses a fair value of US$210. This shows how two investors can look at the same company and arrive at very different conclusions based on their assumptions, and you can use these as reference points when forming your own view.
For Arm Holdings however we will make it really easy for you with previews of two leading Arm Holdings Narratives:
Fair value estimate: US$163.25 per share
Implied undervaluation versus last close: around 35.6%
Forecast revenue growth: 22.17% a year
- Builds on expectations that custom silicon, higher royalty rates and premium IP help support recurring royalties, earnings and margins across AI, IoT and edge use cases.
- Assumes stronger earnings and margins over time, with analysts using higher long term growth and profitability to support a higher fair value estimate than the current share price.
- Highlights execution, R&D spending, customer concentration and geopolitical exposure as key risks that could challenge those assumptions.
Fair value estimate: US$70.00 per share
Implied overvaluation versus last close: around 50.2%
Forecast revenue growth: 4.25% a year
- Frames Arm as an important player in global semiconductors, but concludes that a US$70 intrinsic value, and a risk adjusted level of US$56, sits well below recent trading levels.
- Argues that recent prices in the US$120 to US$140 range reflect enthusiasm that pushes the earnings yield below the 10 year U.S. Treasury, which the author views as a sign of speculative excess.
- Warns that while higher prices up to US$213 are possible in a strong sentiment phase, they would come with limited margin of safety and sensitivity to changes in interest rates, earnings delivery or risk appetite.
Between these two Narratives you can see how the same company can support very different fair value marks, depending on what you believe about Arm's earnings power, AI related opportunities and risk profile. If you want to build and track your own view, you can start by adjusting the growth, margin and P/E assumptions that sit closest to your expectations for the business.
Do you think there's more to the story for Arm Holdings? Head over to our Community to see what others are saying!
This article by Simply Wall St is general in nature. We provide commentary based on historical data and analyst forecasts only using an unbiased methodology and our articles are not intended to be financial advice. It does not constitute a recommendation to buy or sell any stock, and does not take account of your objectives, or your financial situation. We aim to bring you long-term focused analysis driven by fundamental data. Note that our analysis may not factor in the latest price-sensitive company announcements or qualitative material. Simply Wall St has no position in any stocks mentioned.