Assessing Ascendis Pharma (ASND) Valuation After Positive COACH Trial Growth And Proportionality Results
Ascendis Pharma A/S Sponsored ADR ASND | 229.25 | +0.44% |
Ascendis Pharma (NasdaqGS:ASND) is back in focus after releasing Week 52 topline data from its Phase 2 COACH trial, in which once weekly TransCon CNP and TransCon hGH combination therapy produced durable growth and proportionality benefits.
Investors appear to be weighing the fresh COACH trial readout against Ascendis Pharma’s recent share price performance. The stock is at US$215.04 after a 3.0% 7 day share price gain and a 63.4% 1 year total shareholder return, suggesting momentum has been building over the longer term.
If rare disease data like this has your attention, it could be a good moment to see what else is on the move across healthcare stocks.
With Ascendis Pharma posting a 63.4% 1 year total return and trading at US$215.04, plus an indicated intrinsic discount of roughly 77%, you have to ask: is there still a buying opportunity here, or is the market already pricing in future growth?
Most Popular Narrative: 17.4% Undervalued
Against the last close of US$215.04, the most followed narrative pegs Ascendis Pharma's fair value closer to US$260, framing today’s price as discounted.
Regulatory progress and pipeline advancement, such as the priority review for TransCon CNP in achondroplasia and positive combination trial results, are paving the way for new blockbuster therapies and potential multi-billion EUR peak sales opportunities, enhancing future revenue growth and reducing revenue concentration risk.
Curious what earnings, revenue growth, and margin profile would support that higher fair value? The narrative leans on ambitious compounding, richer profitability, and a future P/E that sits above the broader biotech group. The full breakdown shows how those pieces fit together.
Result: Fair Value of $260 (UNDERVALUED)
However, this upbeat narrative still leans heavily on YORVIPATH and SKYTROFA delivering as expected, while any regulatory or safety setbacks could quickly challenge those confidence assumptions.
Another View: Multiples Send a Different Signal
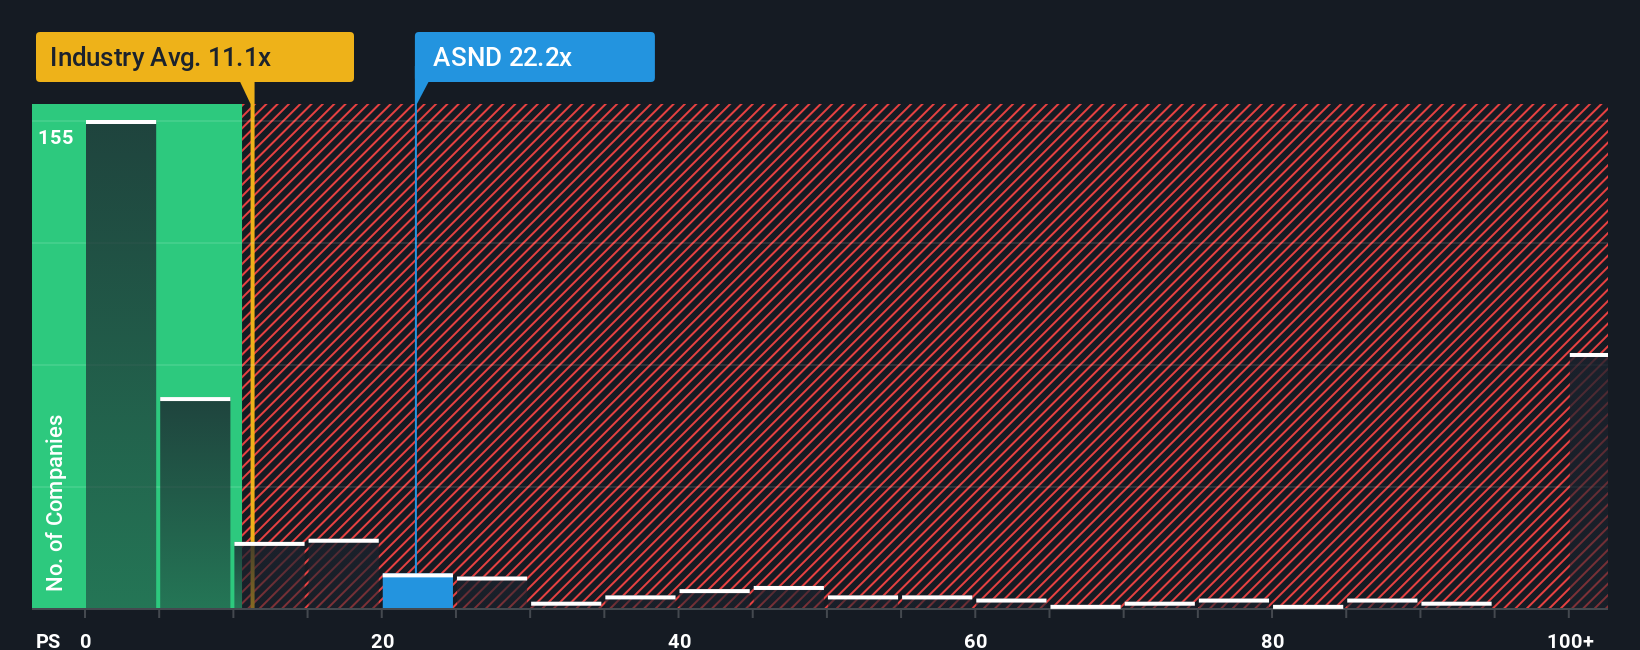
The AI narrative and SWS model point to Ascendis Pharma trading roughly 77% below an implied fair value of US$929.57, which paints a clear undervaluation story. But if you look at pricing based on sales, the picture is more mixed and comes with very different implications.
On P/S, Ascendis trades at 17.6x. That is higher than the US Biotechs industry average of 12.8x and slightly above the SWS fair ratio of 16.9x, yet still well below the peer average of 29.6x. So the stock screens expensive against the broader group, modestly rich versus the level the market could move towards, and cheaper than closer peers. For you, that sets up a simple question: is this a premium you are comfortable paying for the specific story here?
Build Your Own Ascendis Pharma Narrative
If you look at the numbers and reach a different conclusion, or simply prefer your own work, you can build a full Ascendis view yourself in minutes: Do it your way.
A great starting point for your Ascendis Pharma research is our analysis highlighting 4 key rewards and 1 important warning sign that could impact your investment decision.
Looking for more investment ideas?
Before you move on, take a few minutes to scan fresh ideas with clear data behind them so you are not relying on one stock to carry your thesis.
- Spot potential turnarounds early by checking out these 3539 penny stocks with strong financials that already back their stories with stronger balance sheets and fundamentals.
- Review structural shifts in technology by exploring these 24 AI penny stocks that connect artificial intelligence themes to real revenue and business models.
- Focus on price versus cash generation by using these 868 undervalued stocks based on cash flows to see which companies screens flag as trading below their cash flow metrics.
This article by Simply Wall St is general in nature. We provide commentary based on historical data and analyst forecasts only using an unbiased methodology and our articles are not intended to be financial advice. It does not constitute a recommendation to buy or sell any stock, and does not take account of your objectives, or your financial situation. We aim to bring you long-term focused analysis driven by fundamental data. Note that our analysis may not factor in the latest price-sensitive company announcements or qualitative material. Simply Wall St has no position in any stocks mentioned.