Assessing Ashland’s Valuation After Mixed Returns And An Undervalued Cash Flow Narrative
Ashland Inc. ASH | 0.00 |
What Ashland’s recent performance signals for investors
Ashland (ASH) has been relatively steady over the past month, with the stock roughly flat, while it shows a loss over the past 3 months and year to date, but a positive 1 year total return.
For investors, that mixed picture, combined with annual revenue of US$1.81b and a reported net loss of US$685 million, raises questions about how the company’s specialty ingredients portfolio and global footprint are being reflected in the current share price.
At a share price of US$54.46, Ashland’s 90 day share price return of 15.12% and year to date share price return of 9.01% contrast with a 12.27% 1 year total shareholder return. This points to fading momentum after earlier gains.
If Ashland’s recent swings have you rethinking concentration in a single stock, this can be a good moment to broaden your watchlist using 19 top founder-led companies
With Ashland trading at US$54.46, showing an intrinsic discount of 38.74% and a 17.85% gap to analyst targets alongside a US$685 million net loss, is this a mispriced turnaround, or is the market already factoring in future growth?
Most Popular Narrative: 18.8% Undervalued
At $54.46, the most followed narrative pegs Ashland’s fair value at $67.10, using a detailed cash flow and earnings framework anchored by an 8.46% discount rate.
The global shift toward sustainable and bio-based materials driven by regulatory requirements and consumer preference continues to gain momentum, benefiting Ashland's specialty chemicals portfolio that is now more focused on high-value, sustainable, and compliant solutions; this is expected to support top-line revenue growth and margin resilience over the long term.
Curious what has to happen in Ashland's income statement for that fair value to hold up? The story leans heavily on margin rebuild, steady revenue progress, and a future earnings multiple that undercuts many peers. The tension is in how quickly those moving parts line up.
Result: Fair Value of $67.10 (UNDERVALUED)
However, the story can break if demand softness in key export markets persists, or if cost savings dry up and margins fail to move toward analysts’ assumptions.
Another angle on Ashland’s valuation
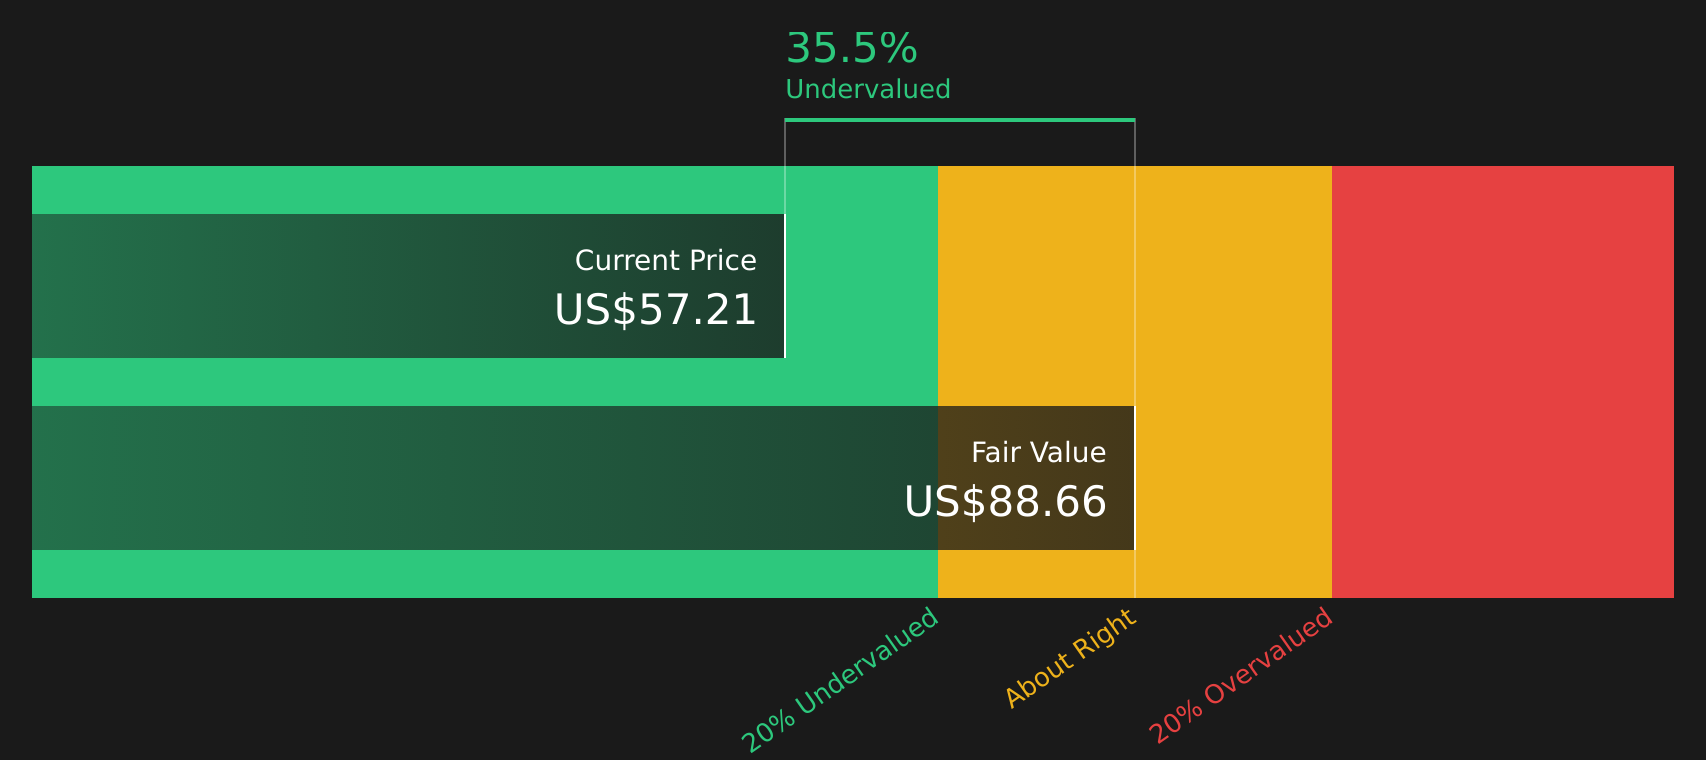
The first narrative leans heavily on a discounted cash flow view, with Ashland trading at a 38.7% discount to an estimated fair value of $88.90. Yet on a simple P/S of 1.4x, the stock looks roughly in line with both the US Chemicals industry average of 1.2x and its peer average of 1.4x. This may limit how much of that modeled upside the market is willing to recognize in the near term.
For a closer look at how sensitive that $88.90 figure is to the inputs in our cash flow model, Look into how the SWS DCF model arrives at its fair value.
Next Steps
With sentiment clearly mixed, and with both risks and rewards on the table, this is the moment to move fast and test the numbers yourself, starting with 2 key rewards and 1 important warning sign
Looking for more investment ideas?
If Ashland has your attention, do not stop here. Broadening your watchlist with focused stock ideas can give you a clearer sense of what stands out.
- Target potential mispricing by scanning companies that combine quality with attractive valuations using the 51 high quality undervalued stocks.
- Prioritise resilience by reviewing stocks that pair balance sheet strength with solid fundamentals through the solid balance sheet and fundamentals stocks screener (44 results).
- Spot early-stage potential by checking a curated set of smaller stocks with stronger financials via the 25 elite penny stocks with strong financials.
This article by Simply Wall St is general in nature. We provide commentary based on historical data and analyst forecasts only using an unbiased methodology and our articles are not intended to be financial advice. It does not constitute a recommendation to buy or sell any stock, and does not take account of your objectives, or your financial situation. We aim to bring you long-term focused analysis driven by fundamental data. Note that our analysis may not factor in the latest price-sensitive company announcements or qualitative material. Simply Wall St has no position in any stocks mentioned.