Assessing ASML Holding (NasdaqGS:ASML) Valuation After Strong Long Term Shareholder Returns
ASML Holding NV ADR ASML | 0.00 |
Event context for ASML Holding (ASML)
With no single headline event driving ASML Holding (NasdaqGS:ASML) today, attention turns to how the stock’s recent performance and fundamentals might help you assess its role in a semiconductor focused portfolio.
The share price has eased in the last week, with a 7 day share price return of 3.23% and a 1 day move of 2.86% lower. However, the 1 year total shareholder return of 104.2% and year to date share price return of 19.11% still point to strong longer term momentum.
If you are comparing ASML with other chip related opportunities, this is a good moment to see how it stacks up against 38 AI infrastructure stocks
With ASML trading at $1,386.21 alongside revenue of €33.7b, net income of €10.0b and a low value score, the key question is whether the stock is still undervalued or if the market is already pricing in future growth.
Preferred P/E of 45.6x: Is it justified?
ASML is trading at a P/E of 45.6x, a level that sits slightly below both its peer group and the broader US semiconductor industry even after a strong 1 year return.
The P/E ratio compares the share price to earnings per share and, for a profitable semiconductor equipment company, it often reflects how much investors are willing to pay for each dollar of current earnings. A higher P/E can signal confidence that earnings will continue to grow, while a lower one can suggest more modest expectations or concern that current profitability may not be sustained.
In ASML's case, the picture is mixed. On one hand, the stock is described as good value versus the US semiconductor industry average P/E of 48.1x and a peer average of 49.4x, and it has high quality earnings with net profit margins of 29.7%. On the other hand, its current P/E of 45.6x sits above an estimated fair P/E of 41.5x. This points to investors paying a premium relative to where the SWS fair ratio suggests the multiple could settle if expectations cooled.
Compared with the industry and peers, the current valuation level signals that the market is still assigning ASML a premium, but not an extreme one, relative to other semiconductor stocks. Against the SWS fair ratio benchmark, however, the stock screens as more expensive. This highlights a tension between market pricing, sector comparisons and a regression based view of what might be a more grounded multiple over time.
Result: Preferred multiple of Price-to-Earnings of 45.6x (OVERVALUED)
However, the preferred P/E still relies on continued demand for advanced lithography equipment and consistent profitability, so any disruption in chip spending or margins could quickly challenge this pricing.
Another view: Cash flows paint a different picture
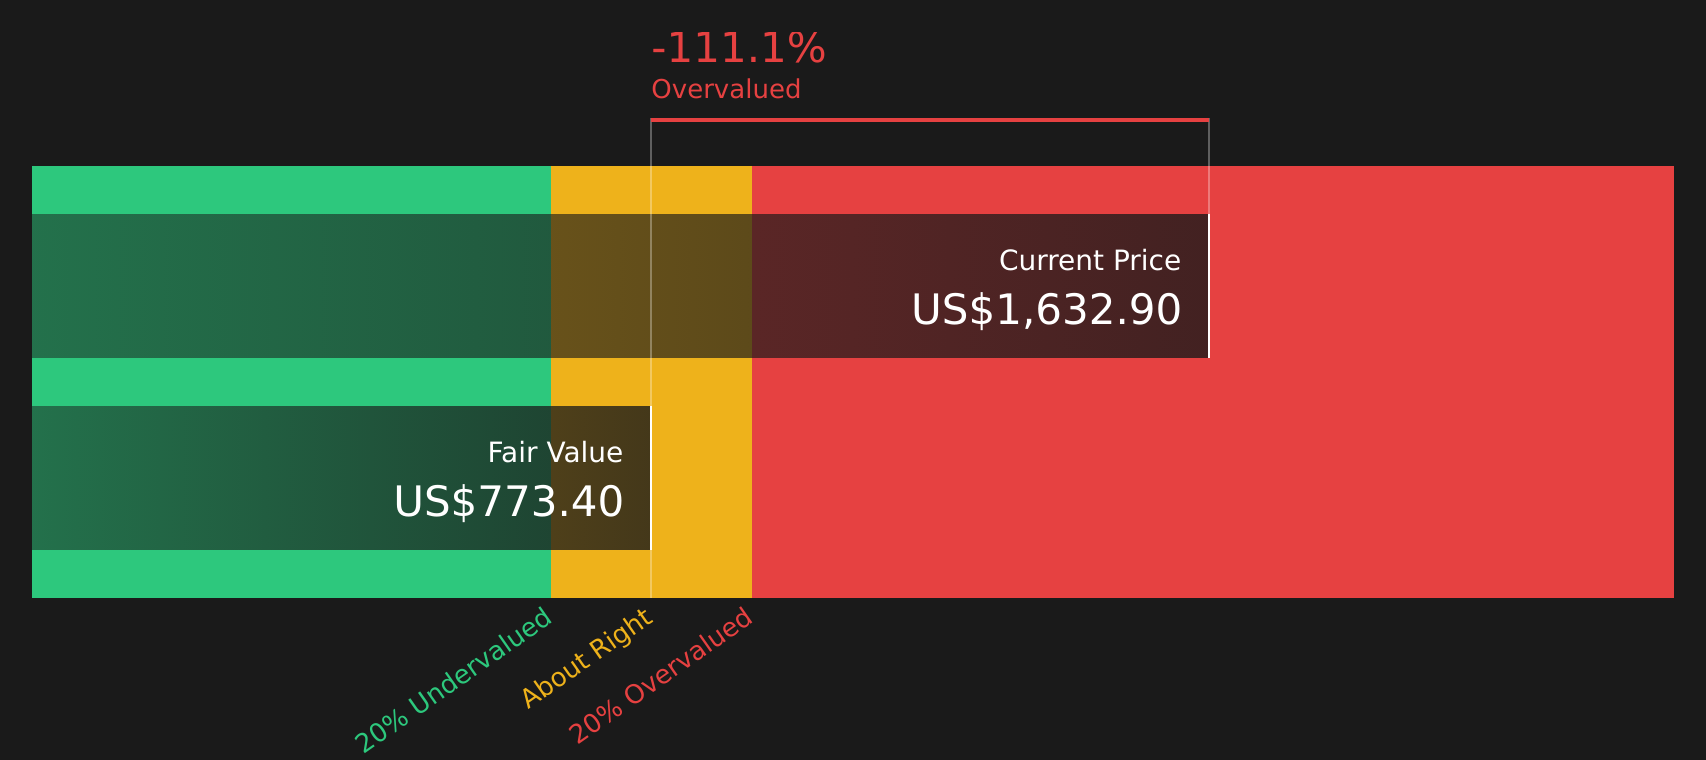
While the P/E points to only a mild premium, our DCF model takes a stricter view. With ASML trading at $1,386.21 versus an estimated future cash flow value of $784.06, the stock screens as expensive on this approach. This raises the question of which signal you trust more for the long haul.
Simply Wall St performs a discounted cash flow (DCF) on every stock in the world every day (check out ASML Holding for example). We show the entire calculation in full. You can track the result in your watchlist or portfolio and be alerted when this changes, or use our stock screener to discover 48 high quality undervalued stocks. If you save a screener we even alert you when new companies match - so you never miss a potential opportunity.
Next Steps
With the mix of signals on valuation in mind, it helps to look past headlines and test the numbers yourself before drawing a firm view. To see why some investors are still optimistic about this stock's potential rewards, take a closer look at the 3 key rewards
Looking for more investment ideas?
If ASML has sharpened your focus on quality, do not stop here. Use screeners to quickly surface stocks that match the kind of portfolio you want to build.
- Spot potential bargains early by checking out 48 high quality undervalued stocks, and see which companies currently price in less optimism than their fundamentals might support.
- Prioritise resilience by scanning 70 resilient stocks with low risk scores, focusing on companies with profiles that may better suit investors who want steadier risk scores.
- Hunt for quality off the beaten path through the screener containing 25 high quality undiscovered gems and see which underfollowed stocks still show strong underlying metrics.
This article by Simply Wall St is general in nature. We provide commentary based on historical data and analyst forecasts only using an unbiased methodology and our articles are not intended to be financial advice. It does not constitute a recommendation to buy or sell any stock, and does not take account of your objectives, or your financial situation. We aim to bring you long-term focused analysis driven by fundamental data. Note that our analysis may not factor in the latest price-sensitive company announcements or qualitative material. Simply Wall St has no position in any stocks mentioned.