Assessing Avista (AVA) Valuation After Prospective 500 Megawatt Customer Agreement
Avista Corporation AVA | 0.00 |
Avista (AVA) has drawn fresh investor attention after signing a non binding memorandum of understanding with a large prospective customer seeking up to 500 megawatts of electric service in its Washington territory.
Despite the announcement, Avista’s recent share price return has been relatively measured. The stock trades at US$41.08 after a 90 day share price return of 2.85% and a 1 year total shareholder return of 15.72%, suggesting steady interest rather than sharp momentum in either direction.
If this potential large load agreement has you thinking about longer term power and grid themes, it could be worth scanning other opportunities across 33 power grid technology and infrastructure stocks
So with Avista trading at US$41.08, sitting close to analyst targets and showing moderate recent returns, is the market already accounting for the potential large load project, or is there still an opening for investors here?
Most Popular Narrative: 4% Undervalued
Avista’s most followed valuation narrative pegs fair value at $42.80, slightly above the current $41.08 share price, framing the stock as modestly discounted rather than deeply mispriced.
The sharp rise in large industrial and commercial load inquiries, with over 3,000 megawatts in the pipeline compared to a roughly 2,000-megawatt current peak load, signals accelerating electrification and potential for outsized rate base and revenue growth if even a fraction of these loads materialize over the next 3 to 5 years. Robust, multi-year capital investment plans approaching $3 billion (2025 to 2029), with additional upside from grid expansion projects and new generation needs tied to large load requests, position Avista to earn regulated returns and drive long-term earnings expansion.
Want to see how those load requests, capital plans and regulated returns are stitched together into one valuation story? The tension lies in how earnings, margins and the future earnings multiple are woven into that $42.80 fair value, and which assumptions need to hold for the narrative to stay intact.
Result: Fair Value of $42.80 (UNDERVALUED)
However, investors still need to watch for localized wildfire and weather risks, as well as the possibility that regulators do not fully approve recovery of rising grid investment costs.
Another View: Cash Flows Paint A Different Picture
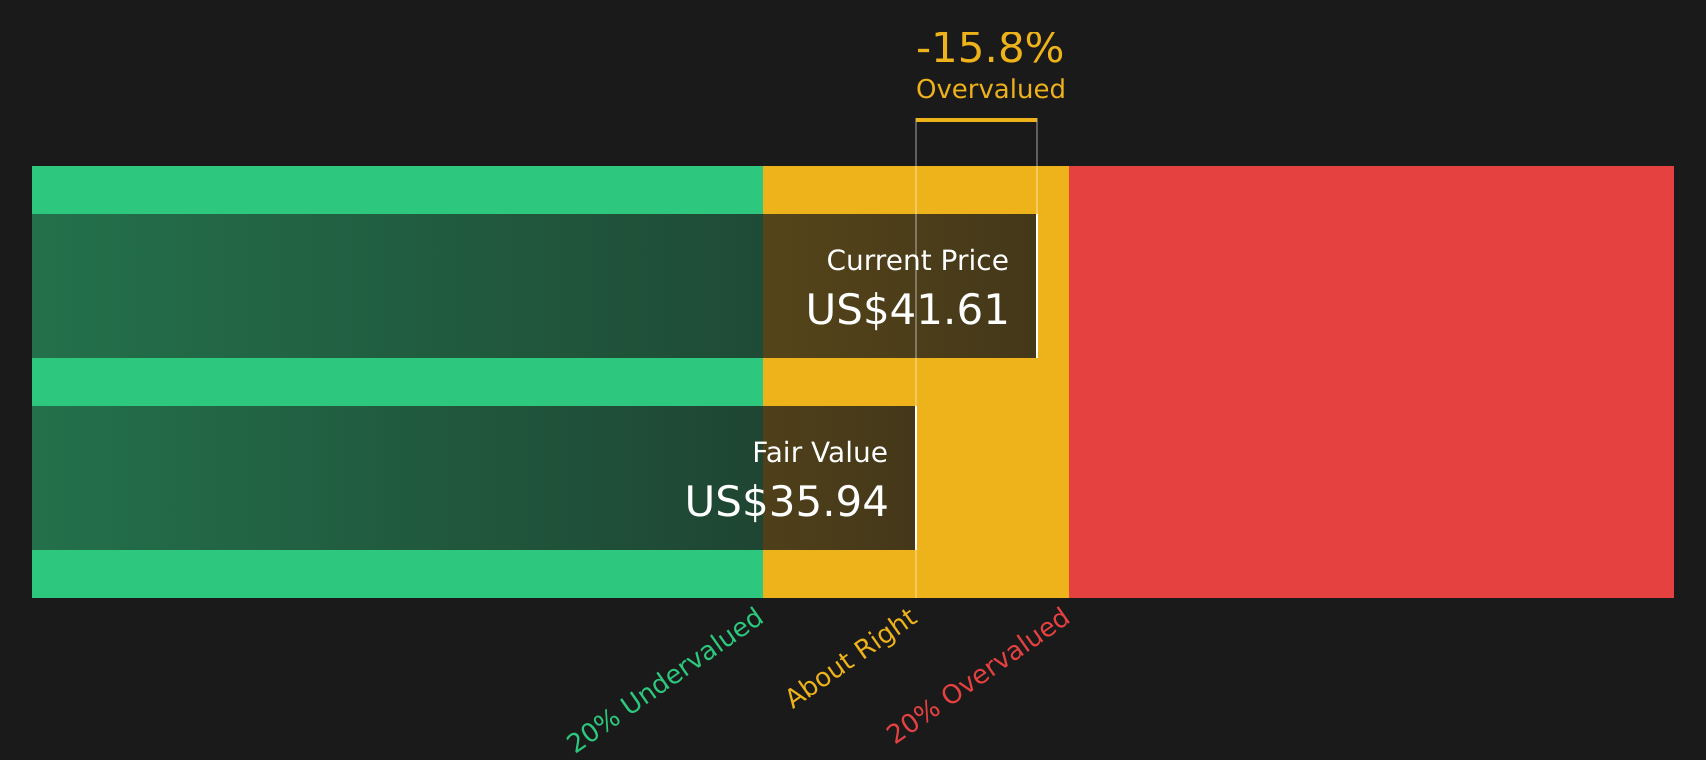
While the popular narrative points to a fair value of $42.80 and a modest 4% undervaluation, the SWS DCF model tells a cooler story. In that framework, Avista at $41.08 trades above an estimated future cash flow value of $35.94, which screens as overvalued rather than cheap. So which lens do you trust more when cash flows and narratives disagree?
Simply Wall St performs a discounted cash flow (DCF) on every stock in the world every day (check out Avista for example). We show the entire calculation in full. You can track the result in your watchlist or portfolio and be alerted when this changes, or use our stock screener to discover 47 high quality undervalued stocks. If you save a screener we even alert you when new companies match - so you never miss a potential opportunity.
Next Steps
With mixed signals on value, risk, and potential reward, do you want to rely on one story or test the numbers yourself? If you are weighing both the concerns and the upside, it could be worth reviewing the 4 key rewards and 2 important warning signs
Looking for more investment ideas?
If you are serious about building a stronger portfolio, do not stop at a single stock story when a wider set of opportunities is just a few clicks away.
- Spot potential mispricing by scanning companies that appear cheap on quality and fundamentals using our 47 high quality undervalued stocks.
- Lock in income-focused ideas by reviewing a curated set of reliable yield payers through the 10 dividend fortresses.
- Shift attention to sturdier balance sheets and cleaner financial profiles with the solid balance sheet and fundamentals stocks screener (47 results).
This article by Simply Wall St is general in nature. We provide commentary based on historical data and analyst forecasts only using an unbiased methodology and our articles are not intended to be financial advice. It does not constitute a recommendation to buy or sell any stock, and does not take account of your objectives, or your financial situation. We aim to bring you long-term focused analysis driven by fundamental data. Note that our analysis may not factor in the latest price-sensitive company announcements or qualitative material. Simply Wall St has no position in any stocks mentioned.