Assessing Baker Hughes (BKR) Valuation After A Strong Multi Month Share Price Run
Baker Hughes Company Class A BKR | 60.38 | +0.07% |
Baker Hughes: recent share move puts fundamentals in focus
Baker Hughes (BKR) has drawn fresh attention after a strong recent run, with the stock showing double digit returns over the month and past 3 months. This performance is prompting investors to reassess its current valuation and business mix.
The recent momentum is not just a one month story. Baker Hughes has a 30 day share price return of 16.45%, a year to date share price return of 38.44%, and a 5 year total shareholder return of 203.20%, suggesting investors have been steadily repricing both its growth prospects and risks.
If this move in energy services has your attention, it could be a good moment to widen your watchlist with 23 power grid technology and infrastructure stocks as another way to spot infrastructure related opportunities.
With Baker Hughes trading around $65.26, showing a 17.64% intrinsic discount yet sitting above the average analyst target of $61.14, the real question is whether you are looking at mispricing or a market already baking in future growth.
Most Popular Narrative: 7% Overvalued
Against Baker Hughes' last close at $65.26, the most followed narrative pegs fair value at $60.80, creating a small valuation gap that hinges on future execution.
The analyst fair value estimate for Baker Hughes has moved modestly higher to $60.80. The shift is supported by a series of recent price target increases from major firms that point to recalibrated assumptions around long term earnings power and sector positioning.
Curious what justifies paying above that fair value line? The narrative leans on steady revenue, firm margins and a richer future earnings multiple. The exact mix may surprise you.
Result: Fair Value of $60.80 (OVERVALUED)
However, investors still need to factor in trade policy shifts and tariff costs, as well as any sharper than expected slowdown in upstream oil and gas spending.
Another Take: DCF Points in a Different Direction
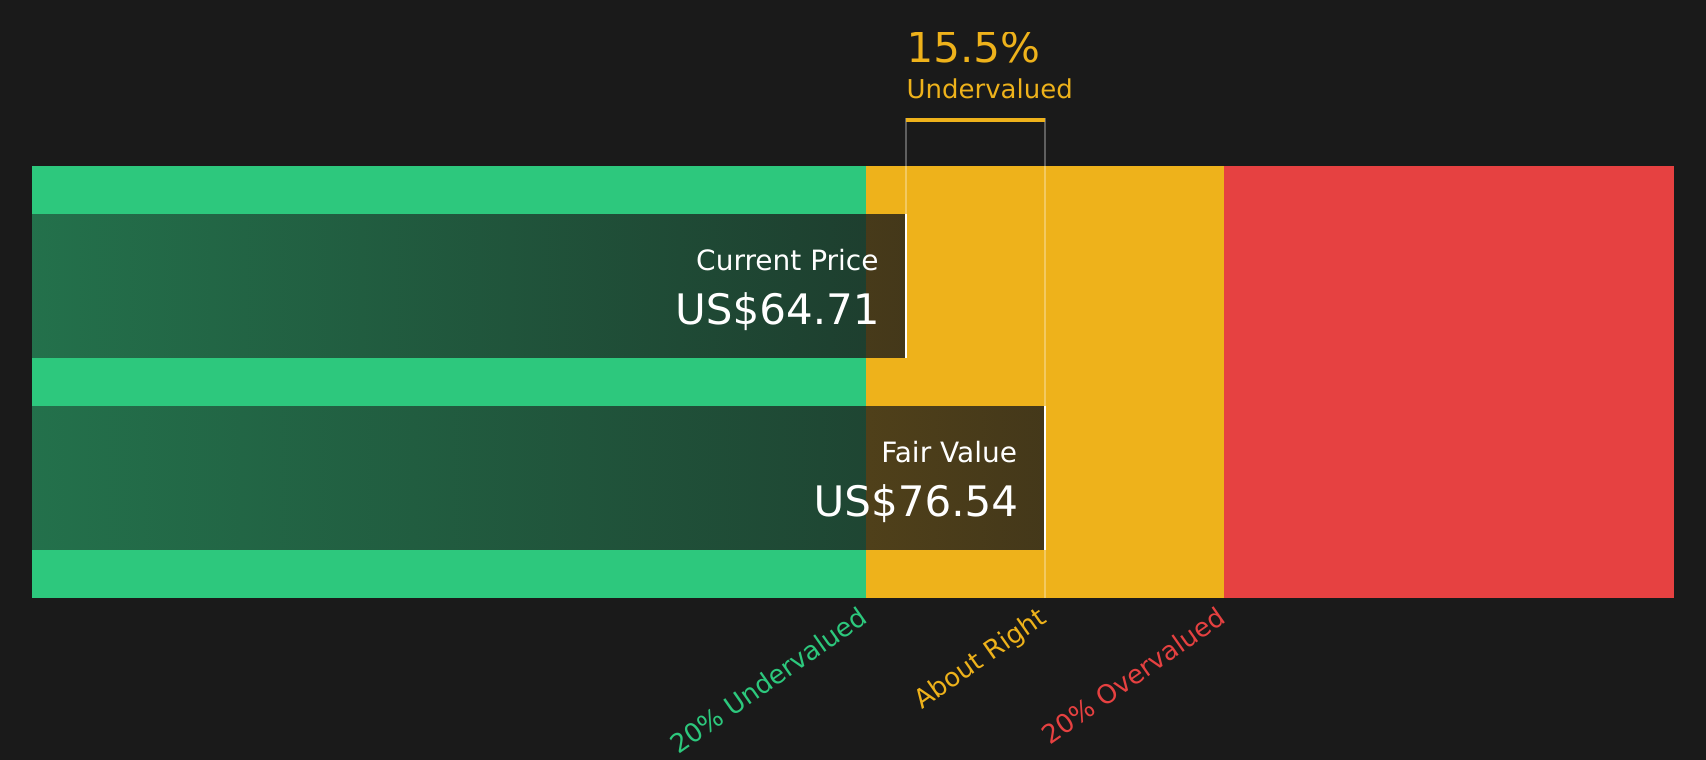
While the popular narrative sees Baker Hughes as about 7% overvalued at $65.26 versus fair value of $60.80, our DCF model indicates a different perspective. It estimates fair value closer to $79.24, which suggests the market could be underpricing Baker Hughes' future cash flows. Which perspective do you find more compelling?
Simply Wall St performs a discounted cash flow (DCF) on every stock in the world every day (check out Baker Hughes for example). We show the entire calculation in full. You can track the result in your watchlist or portfolio and be alerted when this changes, or use our stock screener to discover 49 high quality undervalued stocks. If you save a screener we even alert you when new companies match - so you never miss a potential opportunity.
Next Steps
If this combination of indicators seems contradictory to you, that is intentional.
Ready to line up your next ideas?
If Baker Hughes is on your radar, do not stop there. Use the screener to spot other opportunities that fit your style before the crowd does.
- Target potential mispricing by scanning 49 high quality undervalued stocks to find companies that pair solid fundamentals with prices that may not fully reflect their qualities yet.
- Lock in potential cash flow by reviewing 13 dividend fortresses to identify higher yielding companies with consistent payout records.
- Sleep easier at night by checking 76 resilient stocks with low risk scores to focus on businesses with steadier profiles and lower overall risk scores.
This article by Simply Wall St is general in nature. We provide commentary based on historical data and analyst forecasts only using an unbiased methodology and our articles are not intended to be financial advice. It does not constitute a recommendation to buy or sell any stock, and does not take account of your objectives, or your financial situation. We aim to bring you long-term focused analysis driven by fundamental data. Note that our analysis may not factor in the latest price-sensitive company announcements or qualitative material. Simply Wall St has no position in any stocks mentioned.