Assessing Berkshire Hathaway (BRK.B) Valuation After Recent Muted Share Price Moves
Berkshire Hathaway Inc. Class B BRK.B | 477.35 | -0.24% |
What Berkshire Hathaway’s Latest Numbers Tell You Right Now
Berkshire Hathaway (BRK.B) recently drew attention as its shares closed at $496.12, with one-day and past-week returns slightly negative, inviting a closer look at how the conglomerate’s current fundamentals line up.
Recent trading has been fairly muted, with the share price return over the past month and quarter close to flat, while the 1 year total shareholder return of 9.8% and 5 year total shareholder return of 111.56% suggest momentum has come from holding the stock over time rather than short term moves.
If Berkshire’s steadier profile has you thinking about diversification, this could be a good moment to look at fast growing stocks with high insider ownership as another way to spot ideas worth a closer look.
With Berkshire posting revenue of US$372.1b, net income of US$67.5b and a calculated intrinsic discount of about 37%, you have to ask: is this a classic Buffett bargain, or is the market already pricing in future growth?
Price-to-Earnings of 15.9x: Is It Justified?
On a P/E of 15.9x and a last close of US$496.12, Berkshire Hathaway looks slightly more expensive than its diversified financial peers, but still sits below several direct comparables and an internal fair value estimate.
The P/E multiple simply compares the current share price to earnings per share, so it reflects what investors are currently paying for each dollar of Berkshire’s earnings. For a broad, diversified financial and industrial group with long running operations and multiple business lines, P/E is a common shorthand for how the market views its earnings power today.
Berkshire’s 15.9x P/E is above the US diversified financial industry average of 14.2x, which points to the market assigning a premium to its earnings. However, that same multiple is below a peer average of 27.1x and also below an estimated fair P/E of 18.7x.
Compared with the 14.2x industry average, Berkshire trades at a higher earnings multiple. The gap to the 27.1x peer average and 18.7x fair P/E suggests its current pricing is more conservative than some comparables and the regression based fair ratio would imply.
Result: Price-to-Earnings of 15.9x (ABOUT RIGHT)
However, you still have to weigh weaker annual net income growth of about 0.2% and a 3.1% discount to analyst targets that could limit near term rerating.
Another Angle: What The SWS DCF Model Suggests
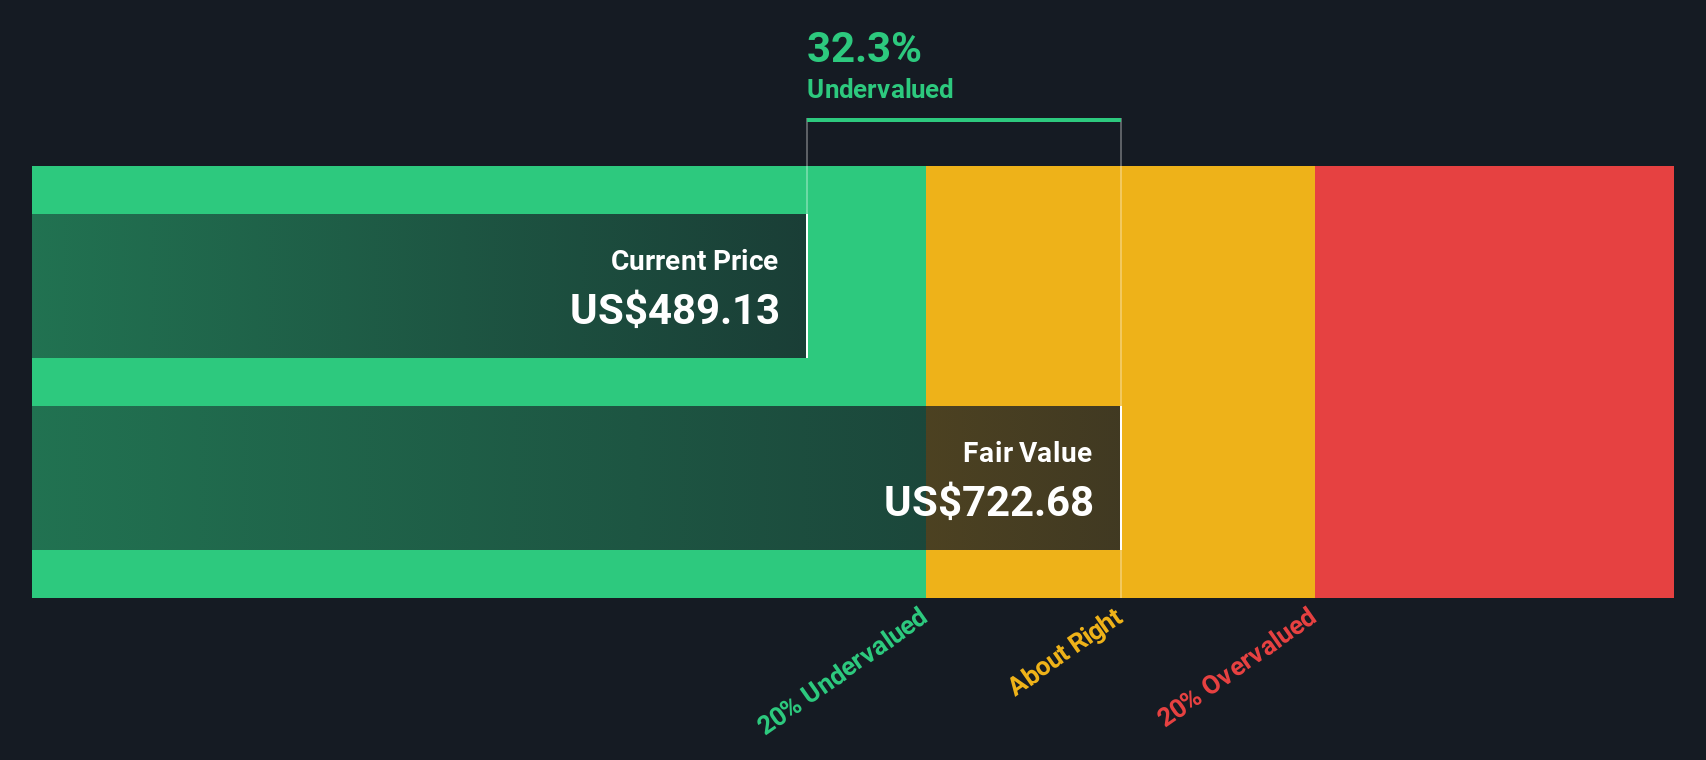
While the 15.9x P/E points to Berkshire trading slightly richer than the diversified financial industry, our DCF model presents a different perspective, with an estimated fair value of about US$784.29 per share versus the current US$496.12, implying a discount of roughly 37%.
If earnings are expected to slip by around 0.2% a year over the next three years, yet the SWS DCF model still indicates that Berkshire is undervalued, it raises a useful question for you as an investor: which signal do you place greater weight on, today’s earnings multiple or the longer term cash flow view?
Simply Wall St performs a discounted cash flow (DCF) on every stock in the world every day (check out Berkshire Hathaway for example). We show the entire calculation in full. You can track the result in your watchlist or portfolio and be alerted when this changes, or use our stock screener to discover 880 undervalued stocks based on their cash flows. If you save a screener we even alert you when new companies match - so you never miss a potential opportunity.
Build Your Own Berkshire Hathaway Narrative
If parts of this view do not quite fit how you see Berkshire, that is fine. You can quickly build your own version in just a few minutes, starting with Do it your way.
A great starting point for your Berkshire Hathaway research is our analysis highlighting 1 key reward and 2 important warning signs that could impact your investment decision.
Ready To Hunt For Your Next Idea?
If Berkshire feels like just one piece of your portfolio puzzle, do not stop here. Use the screener to quickly surface fresh, high conviction ideas worth your attention.
- Target dependable income by scanning these 12 dividend stocks with yields > 3% that focus on regular cash returns to shareholders.
- Spot potential growth in digital assets by reviewing these 79 cryptocurrency and blockchain stocks tied to blockchain and cryptocurrency trends.
- Zero in on value by assessing these 880 undervalued stocks based on cash flows that currently trade below their estimated cash flow potential.
This article by Simply Wall St is general in nature. We provide commentary based on historical data and analyst forecasts only using an unbiased methodology and our articles are not intended to be financial advice. It does not constitute a recommendation to buy or sell any stock, and does not take account of your objectives, or your financial situation. We aim to bring you long-term focused analysis driven by fundamental data. Note that our analysis may not factor in the latest price-sensitive company announcements or qualitative material. Simply Wall St has no position in any stocks mentioned.