Assessing Cabaletta Bio (CABA) Valuation After FDA Clearance For Automated CAR T Manufacturing
Cabaletta Bio CABA | 2.96 | +10.45% |
Cabaletta Bio (CABA) is back in focus after Cellares received FDA clearance for an IND amendment supporting automated manufacturing and quality testing of Cabaletta’s investigational CAR T therapy, rese cel, using Cell Shuttle and Cell Q platforms.
The FDA clearance news arrives after a sharp shift in sentiment, with Cabaletta Bio’s 7 day share price return of 44.55% and 30 day return of 45.21% contrasting with a 3 year total shareholder return decline of 73.19%. This suggests momentum has recently picked up from a much weaker long term base.
If this kind of biotech catalyst has your attention, it could be a good moment to look across other healthcare stocks that may be setting up for their own next move.
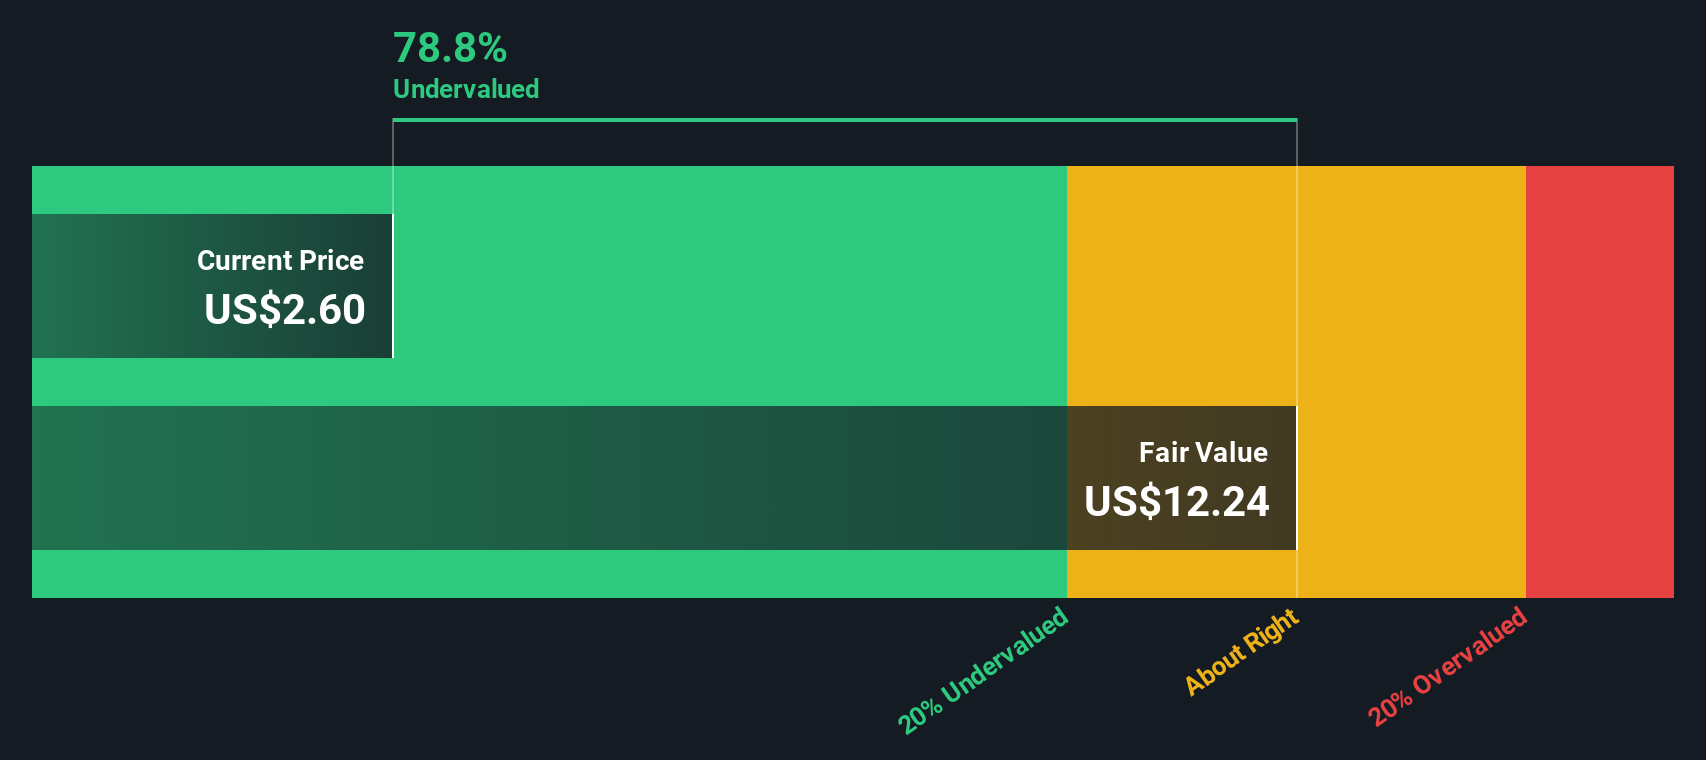
With Cabaletta Bio trading at US$3.18 and a published analyst price target of US$13.13, the gap is wide. However, recent gains are sharp, so is this an underappreciated entry point, or is the market already pricing in future growth?
Preferred Multiple of 2.2x P/B: Is it justified?
On our numbers, Cabaletta Bio looks inexpensive on a P/B basis, with a 2.2x ratio flagged as good value relative to both peers and the wider US biotech group.
P/B, or price to book ratio, compares the company’s market value to the accounting value of its net assets. For early stage biotechs that are loss making and have little or no revenue, P/B is often one of the few conventional valuation gauges that can still be applied in a straightforward way.
In Cabaletta Bio’s case, a 2.2x P/B sits below the US biotechs industry average of 2.7x and far below a peer average of 42.4x. That gap suggests the market is assigning a much lower value to Cabaletta’s asset base than to many similar names, even as the company progresses a pipeline of engineered T cell therapies and remains unprofitable with a reported net loss of $158.523m.
Result: Price to book ratio of 2.2x (UNDERVALUED)
However, you are still dealing with a clinical stage biotech that reports a net loss of US$158.523m and no revenue, so trial or regulatory setbacks could quickly challenge the current P/B story.
Another View: What Our DCF Model Says
While the 2.2x P/B suggests Cabaletta Bio looks inexpensive, our DCF model paints an even more extreme picture. It flags the shares as trading about 98.5% below an estimated future cash flow value of $217.39 per share, which is a very large gap. Is this a signal or just noise from aggressive assumptions?
Simply Wall St performs a discounted cash flow (DCF) on every stock in the world every day (check out Cabaletta Bio for example). We show the entire calculation in full. You can track the result in your watchlist or portfolio and be alerted when this changes, or use our stock screener to discover 864 undervalued stocks based on their cash flows. If you save a screener we even alert you when new companies match - so you never miss a potential opportunity.
Build Your Own Cabaletta Bio Narrative
If you see things differently or simply prefer to test the numbers yourself, you can build a fresh view in just a few minutes, starting with Do it your way.
A great starting point for your Cabaletta Bio research is our analysis highlighting 1 key reward and 5 important warning signs that could impact your investment decision.
Looking for more investment ideas?
If Cabaletta Bio has sparked your interest, do not stop here. Broaden your watchlist now so you do not miss the next opportunity on your radar.
- Spot potential value early by checking out these 3523 penny stocks with strong financials that already show solid underlying financial strength.
- Consider the AI theme more intentionally by reviewing these 24 AI penny stocks that focus on artificial intelligence across different sectors.
- Explore your income stream options by scanning these 13 dividend stocks with yields > 3% that may suit investors who prioritize regular cash returns.
This article by Simply Wall St is general in nature. We provide commentary based on historical data and analyst forecasts only using an unbiased methodology and our articles are not intended to be financial advice. It does not constitute a recommendation to buy or sell any stock, and does not take account of your objectives, or your financial situation. We aim to bring you long-term focused analysis driven by fundamental data. Note that our analysis may not factor in the latest price-sensitive company announcements or qualitative material. Simply Wall St has no position in any stocks mentioned.