Assessing CECO Environmental (CECO) Valuation After Strong Revenue Growth And Profitability Improvements
CECO Environmental Corp. CECO | 62.18 | +1.11% |
Why CECO Environmental’s recent operating trends have caught investor attention
CECO Environmental (CECO) has drawn interest after sustaining 19% annual revenue growth over the past two years, alongside stronger returns on capital and higher adjusted operating profits driven by greater cost efficiency.
For investors, this combination of steady top line expansion and improving profitability metrics points to a business that appears to be gaining share in its markets while making better use of the capital it deploys.
CECO Environmental’s share price has climbed to $61.8, with a 27.37% 90 day share price return and a very large 5 year total shareholder return of about 7x, which points to building momentum around its recent operating progress.
If CECO’s gains have you curious about what else is working in the market, this could be a good moment to widen your search with fast growing stocks with high insider ownership.
With CECO trading at $61.80 and sitting only about 2% below its average analyst price target, yet around 10% below one intrinsic value estimate, you have to ask: is there still a buying opportunity here, or is the market already pricing in future growth?
Most Popular Narrative: 2.2% Undervalued
With CECO Environmental last closing at $61.80 against a narrative fair value of $63.17, the current setup centers on how much growth is already priced in.
Record-high backlog and robust pipeline growth, especially in power generation, industrial water, and natural gas infrastructure, suggest that increasing global enforcement of environmental regulations is translating into sustained demand and forward visibility for CECO's solutions, supporting topline revenue growth over the next 18 to 24 months.
Curious what growth path needs to play out for that valuation to hold up? Revenue expansion, margin shape and a richer future earnings multiple all sit at the core of this narrative. The detailed projections connect today’s price to tomorrow’s earnings power. The full story is in how those pieces fit together.
Result: Fair Value of $63.17 (UNDERVALUED)
However, there is still the risk that higher expenses, rising net debt, and any slowdown in bookings or large project awards could quickly pressure margins and earnings expectations.
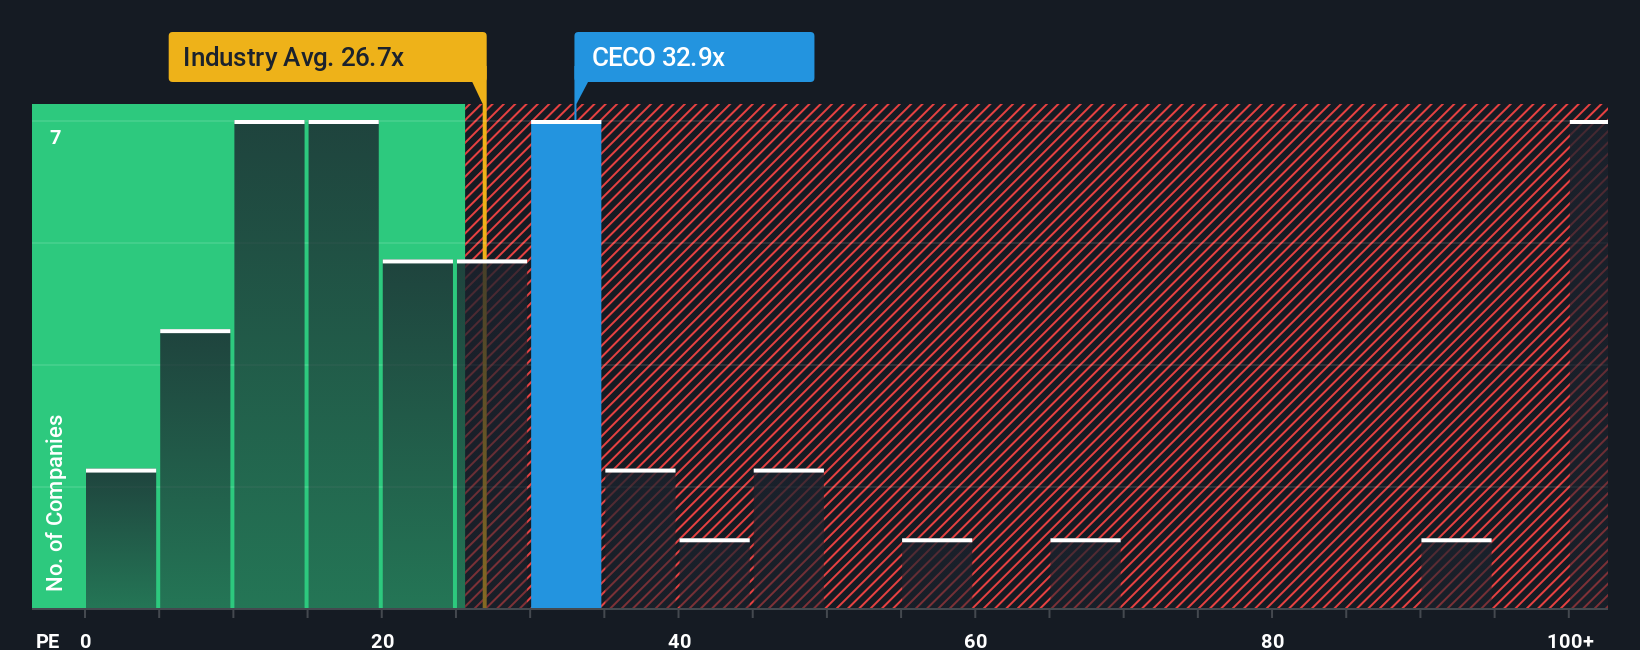
Another View: Earnings Multiple Sends A Different Signal
Our narrative fair value of US$63.17 suggests CECO Environmental is about 2.2% undervalued. Yet on a simple earnings multiple, the story looks tighter. The shares trade on a P/E of 42.5x, compared with a fair ratio of 19.1x, the US Machinery industry at 26.3x, and peers at 38x. This suggests a lot of future delivery is already baked in and leaves less room for disappointment if expectations cool.
Build Your Own CECO Environmental Narrative
If you look at the numbers and come to a different conclusion, or simply want your own view grounded in the data, you can build a full CECO thesis in just a few minutes with Do it your way.
A great starting point for your CECO Environmental research is our analysis highlighting 3 key rewards and 2 important warning signs that could impact your investment decision.
Looking for more investment ideas?
If CECO has sparked your interest, do not stop there, the market is full of other angles that could fit your goals just as well.
- Spot potential value plays early by scanning these 882 undervalued stocks based on cash flows that might be trading below what their cash flows suggest.
- Ride long term trends in automation and data by checking out these 28 AI penny stocks shaping how businesses use artificial intelligence.
- Boost your income focus by reviewing these 12 dividend stocks with yields > 3% that offer yields above 3% while you assess their fundamentals.
This article by Simply Wall St is general in nature. We provide commentary based on historical data and analyst forecasts only using an unbiased methodology and our articles are not intended to be financial advice. It does not constitute a recommendation to buy or sell any stock, and does not take account of your objectives, or your financial situation. We aim to bring you long-term focused analysis driven by fundamental data. Note that our analysis may not factor in the latest price-sensitive company announcements or qualitative material. Simply Wall St has no position in any stocks mentioned.