Assessing Celcuity (CELC) Valuation After FDA Priority Review Milestone For Gedatolisib
Celcuity Inc. CELC | 0.00 |
Celcuity (CELC) has moved into focus after the FDA accepted its New Drug Application for gedatolisib in HR+/HER2-, PIK3CA wild-type advanced breast cancer, granting Priority Review and setting a July 17, 2026 PDUFA date.
That regulatory milestone comes after a strong run in the stock, with a 30 day share price return of 12.21%, a 90 day share price return of 45.31%, and a very large 1 year total shareholder return. This suggests momentum has been building around the gedatolisib story.
If this kind of FDA driven move has your attention, it could be a good time to look at other healthcare stocks that are grabbing interest for different reasons.
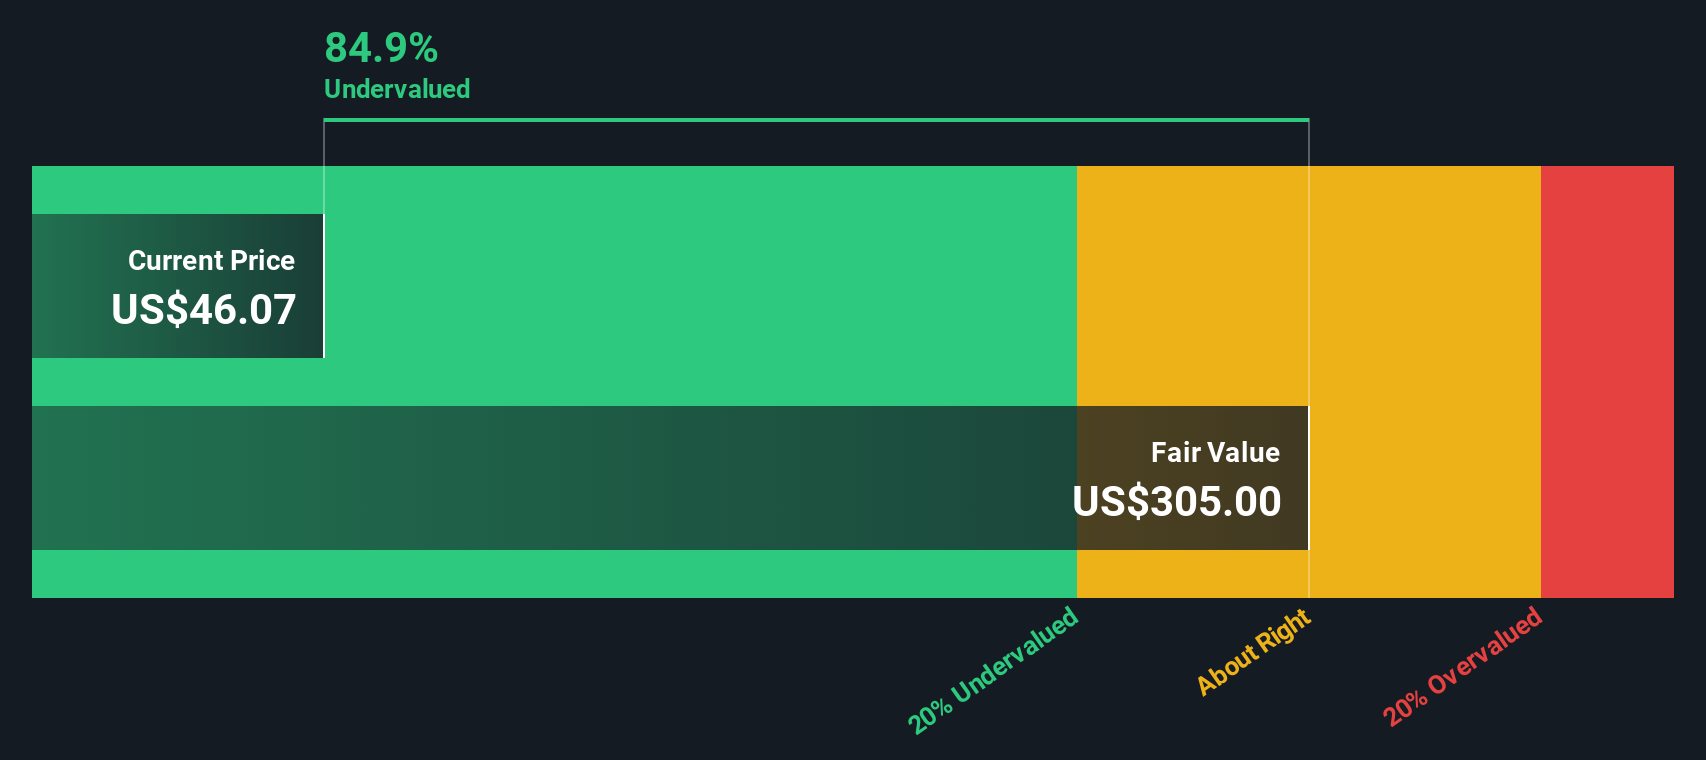
So with Celcuity trading around its recent gains, a value score of 2, a price near its analyst target, and an intrinsic discount suggesting upside, is there still a buying opportunity here, or is the market already pricing in future growth?
Preferred Price to Book Multiple of 44.4x: Is it justified?
On simple metrics, Celcuity looks expensive, with a P/B of 44.4x versus 2.7x for the broader US biotech group and 14.5x for its closer peers.
P/B compares the company’s market value to its book value, so a higher ratio often reflects high expectations for future returns on the capital already invested in the business. For an unprofitable, clinical stage biotech with $0 in revenue and a net loss of $162.7m, a P/B of 44.4x points to the market placing substantial weight on future cash flows rather than today’s balance sheet.
The gap to both the US Biotechs industry average and the peer average is wide. This indicates investors are paying a significant premium for Celcuity’s pipeline and forecast growth profile. According to the SWS DCF model, that optimism is partly grounded in cash flow assumptions, with the shares trading at $112.12 against an estimated future cash flow value of $536.83, or about 79.1% below that DCF fair value.
Result: Price-to-book ratio of 44.4x (OVERVALUED)
However, there are still clear risks, including FDA review outcomes for gedatolisib and the company’s current position with $0 revenue and a net loss of $162.7 million.
Another View: DCF Points in the Opposite Direction
While the 44.4x P/B ratio makes Celcuity look expensive next to the US biotech average of 2.7x and peer average of 14.5x, the SWS DCF model tells a very different story. At $112.12 versus an estimated future cash flow value of $536.83, the model suggests the shares are undervalued. Which signal would you put more weight on: today’s balance sheet or long term cash flow potential?
Simply Wall St performs a discounted cash flow (DCF) on every stock in the world every day (check out Celcuity for example). We show the entire calculation in full. You can track the result in your watchlist or portfolio and be alerted when this changes, or use our stock screener to discover 865 undervalued stocks based on their cash flows. If you save a screener we even alert you when new companies match - so you never miss a potential opportunity.
Build Your Own Celcuity Narrative
If you look at the numbers and reach a different conclusion, or simply want to test your own assumptions using the same data, you can build a custom view in just a few minutes, starting with Do it your way.
A great starting point for your Celcuity research is our analysis highlighting 2 key rewards and 2 important warning signs that could impact your investment decision.
Ready for more stock ideas to compare with Celcuity?
If gedatolisib has you thinking bigger about your portfolio, do not stop with one name. Use screeners to spot other ideas before the crowd does.
- Scan for smaller companies with potential using these 3527 penny stocks with strong financials that stand out on financial strength instead of just headlines.
- Target the intersection of healthcare and AI by checking out these 110 healthcare AI stocks that are working on data driven tools and treatments.
- Hunt for potential mispricing by reviewing these 865 undervalued stocks based on cash flows where current prices differ from underlying cash flow estimates.
This article by Simply Wall St is general in nature. We provide commentary based on historical data and analyst forecasts only using an unbiased methodology and our articles are not intended to be financial advice. It does not constitute a recommendation to buy or sell any stock, and does not take account of your objectives, or your financial situation. We aim to bring you long-term focused analysis driven by fundamental data. Note that our analysis may not factor in the latest price-sensitive company announcements or qualitative material. Simply Wall St has no position in any stocks mentioned.