Assessing CMS Energy (CMS) Valuation As Regulatory Optimism And Earnings Expectations Gain Traction
CMS Energy Corporation CMS | 78.58 | +0.85% |
Analyst commentary around CMS Energy (CMS) has sharpened investor focus on the company’s regulatory backdrop and upcoming earnings report, linking expectations for allowed return on equity with its long-term capital and clean energy plans.
CMS Energy’s share price has been relatively steady at around $71.49, with a 1 month share price return of 1.52% and a 1 year total shareholder return of 11.63%. This suggests modest recent momentum alongside more meaningful multi year compounding.
If you are weighing CMS Energy against other options in the utilities and infrastructure space, it can be useful to see how regulated names compare with solid balance sheet and fundamentals stocks screener (None results).
So with the shares around $71.49, a value score of 2 and analysts highlighting both regulatory support and earnings potential, are you looking at an underappreciated utility, or has the market already priced in the next leg of growth?
Most Popular Narrative: 7.7% Undervalued
With CMS Energy at $71.49 against a narrative fair value of about $77.46, the gap comes down to how you view future earnings power under Michigan regulation and long term capital plans.
A robust $25+ billion pipeline in grid modernization and renewable investments, paired with supportive federal policies and tax credits, positions CMS Energy to capitalize on regulatory approved projects and improve return on equity, supporting long term earnings growth.
Want to see what really underpins that fair value gap? The narrative leans on specific revenue growth, margin expansion and a future earnings multiple that assumes steady execution. Curious how those pieces fit together over the next few years, and what has to go right for that valuation to hold up?
Result: Fair Value of $77.46 (UNDERVALUED)
However, that underappreciated angle can quickly fade if large data center or load growth assumptions fall short, or if Michigan regulators become less supportive on cost recovery.
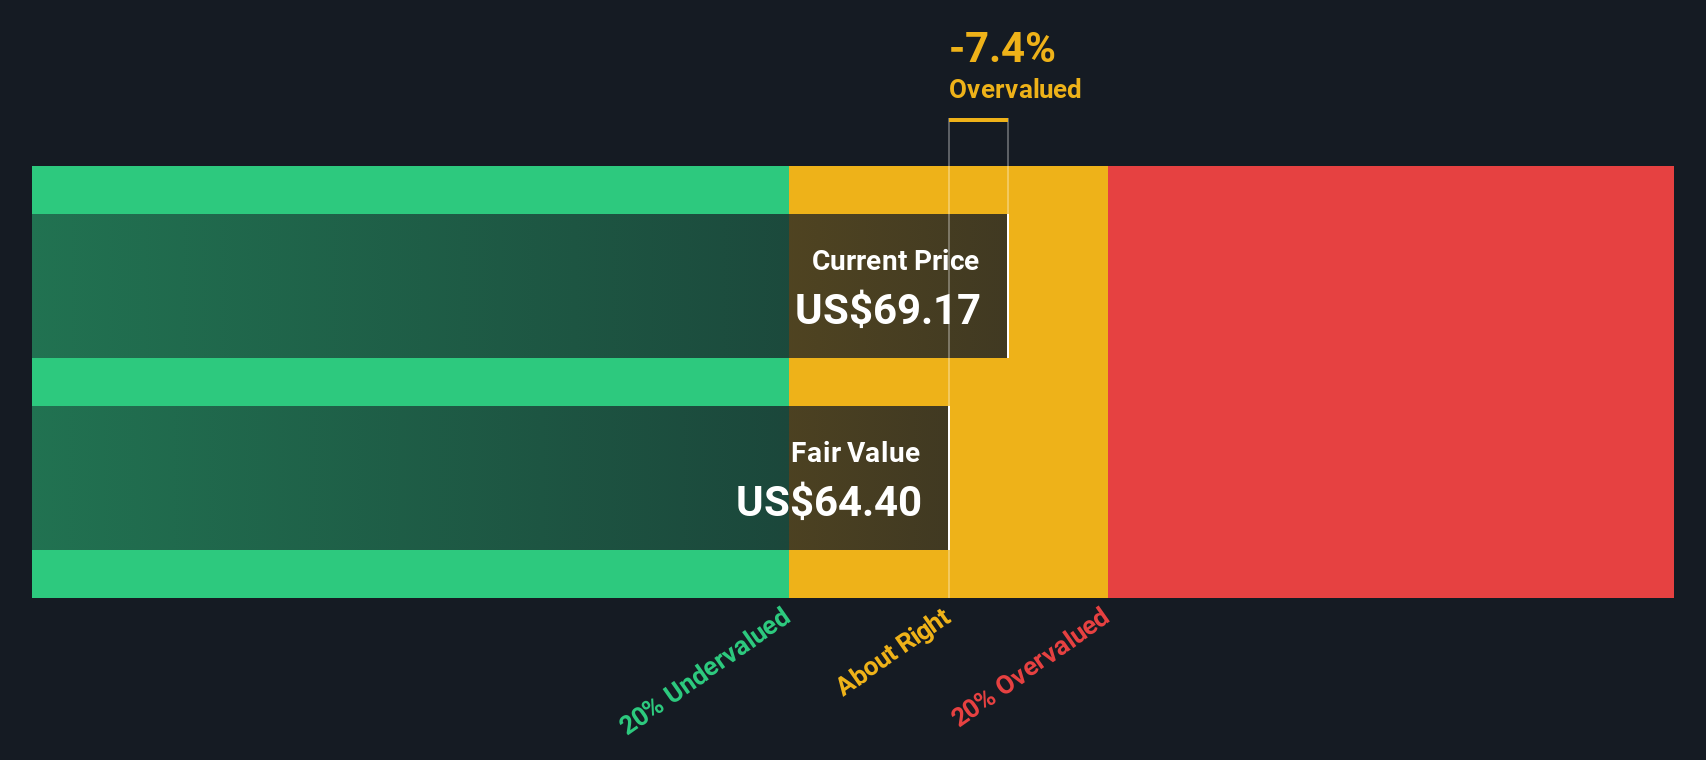
Another View: Cash Flows Paint A Tighter Picture
There is also our DCF model, which points to a fair value of about $67.16 per share, compared with the current $71.49 price. That suggests CMS Energy screens as slightly overvalued on cash flows. How much weight do you want to give earnings-based targets versus this cash-based view?
Simply Wall St performs a discounted cash flow (DCF) on every stock in the world every day (check out CMS Energy for example). We show the entire calculation in full. You can track the result in your watchlist or portfolio and be alerted when this changes, or use our stock screener to discover 874 undervalued stocks based on their cash flows. If you save a screener we even alert you when new companies match - so you never miss a potential opportunity.
Build Your Own CMS Energy Narrative
If this take does not quite fit how you see CMS Energy, or you would rather rely on your own work, you can create a personalized narrative in just a few minutes with Do it your way.
A great starting point for your CMS Energy research is our analysis highlighting 1 key reward and 2 important warning signs that could impact your investment decision.
Looking for more investment ideas?
If you are serious about building a stronger portfolio, do not stop with one utility, use the Simply Wall Street Screener to spot other opportunities worth your time.
- Spot potential mispricings by reviewing these 874 undervalued stocks based on cash flows that may offer more attractive entry points based on their cash flow profiles.
- Target income focused opportunities by scanning these 12 dividend stocks with yields > 3% that currently offer yields above 3%.
- Position yourself in high growth themes by checking out these 24 AI penny stocks that are tied to advances in artificial intelligence.
This article by Simply Wall St is general in nature. We provide commentary based on historical data and analyst forecasts only using an unbiased methodology and our articles are not intended to be financial advice. It does not constitute a recommendation to buy or sell any stock, and does not take account of your objectives, or your financial situation. We aim to bring you long-term focused analysis driven by fundamental data. Note that our analysis may not factor in the latest price-sensitive company announcements or qualitative material. Simply Wall St has no position in any stocks mentioned.