Assessing DRDGOLD (NYSE:DRD) Valuation After Updated 2026 Production Guidance
DRDGOLD Ltd. Sponsored ADR DRD | 0.00 |
Why DRDGOLD’s updated production guidance matters now
DRDGOLD (DRD) updated investors on 9 February 2026, saying it is trending toward the upper end of its 140,000 to 150,000 ounce production guidance for the year to 30 June 2026.
The company also reiterated expected cash operating costs of about R995,000/kg, with unit costs anticipated to stay within the guided range. This gives investors a clearer picture of potential output and cost discipline for the current financial year.
That guidance update lands after a powerful run, with a 90 day share price return of 28.1% and a very large 1 year total shareholder return, even though the 30 day share price return of a 1.63% decline hints that momentum has cooled slightly in the near term.
If this gold update has your attention, it might be a good moment to see what else is moving in the sector through our 21 elite gold producer stocks.
With DRDGOLD trending toward the upper end of its output guidance, a value score of 4, a large 1 year total return and an indicated intrinsic discount of around 62%, is this still an opportunity for investors or has the market already priced in future growth?
Price-to-Earnings of 21.9x: Is it justified?
Using earnings as the yardstick, DRDGOLD’s current P/E of 21.9x, alongside a last close of $35.65, screens as good value relative to peers in the Metals and Mining space.
The P/E multiple tells you how much investors are paying today for each dollar of current earnings. For a mature producer that already has positive earnings, it is a straightforward way to compare expectations across the sector without getting lost in short term gold price moves.
Here, DRDGOLD’s 21.9x P/E sits below both the US Metals and Mining industry average of 25.3x and the closer peer average of 29.8x. Combined with high quality earnings, a 25.2% return on equity and profit growth that has outpaced the wider industry, the market is currently valuing those earnings at a discount to comparable names, rather than paying a premium for recent outperformance.
Result: Price-to-Earnings of 21.9x (UNDERVALUED)
However, you still need to weigh risks such as sensitivity to gold prices and the operational concentration in South Africa, which could quickly change the story.
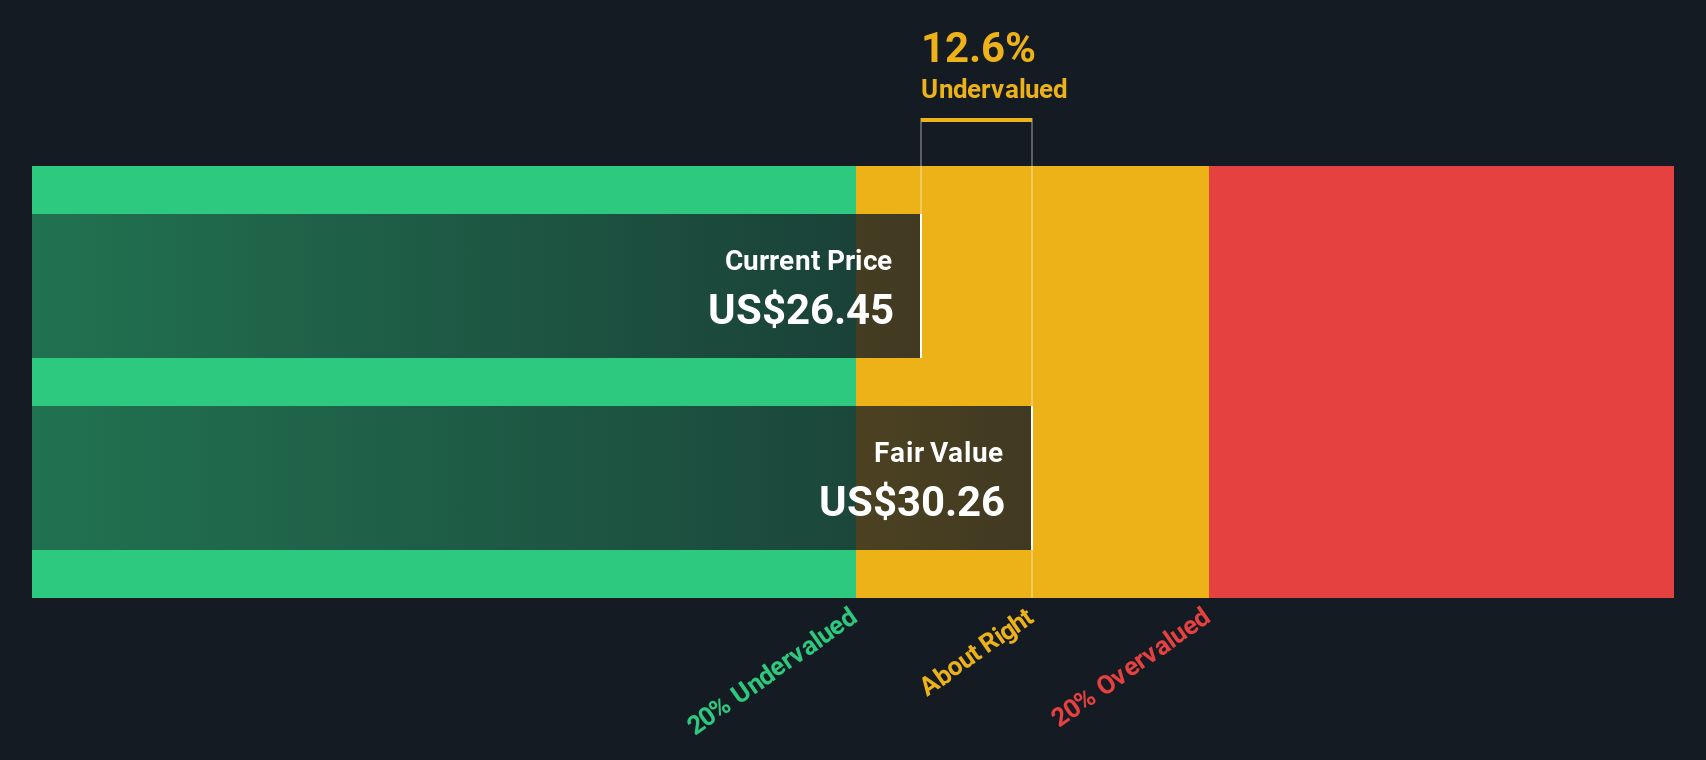
Another view using our DCF model
The P/E makes DRDGOLD look cheap, but our DCF model provides a different perspective. It estimates a future cash flow value of $94.68 per share compared with the current $35.65 price. That suggests DRDGOLD is trading well below this calculated value, raising the question of whether the market is being too cautious.
Simply Wall St performs a discounted cash flow (DCF) on every stock in the world every day (check out DRDGOLD for example). We show the entire calculation in full. You can track the result in your watchlist or portfolio and be alerted when this changes, or use our stock screener to discover 53 high quality undervalued stocks. If you save a screener we even alert you when new companies match - so you never miss a potential opportunity.
Build Your Own DRDGOLD Narrative
If you see the numbers differently, or simply prefer to test your own assumptions, you can build a fresh DRDGOLD view in just a few minutes by starting with Do it your way.
A great starting point for your DRDGOLD research is our analysis highlighting 3 key rewards and 1 important warning sign that could impact your investment decision.
Ready for more investment ideas beyond DRDGOLD?
If this has sharpened your thinking, do not stop here. Use the screener to quickly surface fresh ideas that fit exactly how you like to invest.
- Target potential mispricing and quickly scan companies trading below their estimates of value through our 53 high quality undervalued stocks.
- Focus on resilience first by filtering for companies flagged in our 84 resilient stocks with low risk scores that score well on key risk checks.
- Hunt for under the radar opportunities with strong fundamentals using the screener containing 23 high quality undiscovered gems that many investors may not yet be watching.
This article by Simply Wall St is general in nature. We provide commentary based on historical data and analyst forecasts only using an unbiased methodology and our articles are not intended to be financial advice. It does not constitute a recommendation to buy or sell any stock, and does not take account of your objectives, or your financial situation. We aim to bring you long-term focused analysis driven by fundamental data. Note that our analysis may not factor in the latest price-sensitive company announcements or qualitative material. Simply Wall St has no position in any stocks mentioned.