Assessing Energy Transfer (ET) Valuation After Recent Trading Cooldown
Energy Transfer ET | 0.00 |
Energy Transfer stock snapshot
Energy Transfer (ET) has drawn fresh attention after recent trading swings, with the unit price closing at US$19.04. The stock is down over the past week and month, but higher over the past year.
Recent trading has cooled slightly, with a 30 day share price return of down 2.91% and a 7 day move of down 2.61%. However, the year to date share price return of 14.77% and 1 year total shareholder return of 12.40% indicate that momentum has been more supportive over a longer window.
If you are comparing Energy Transfer with other infrastructure focused plays, it is a good time to scan the grid and see which utilities and equipment operators appear in our 34 power grid technology and infrastructure stocks
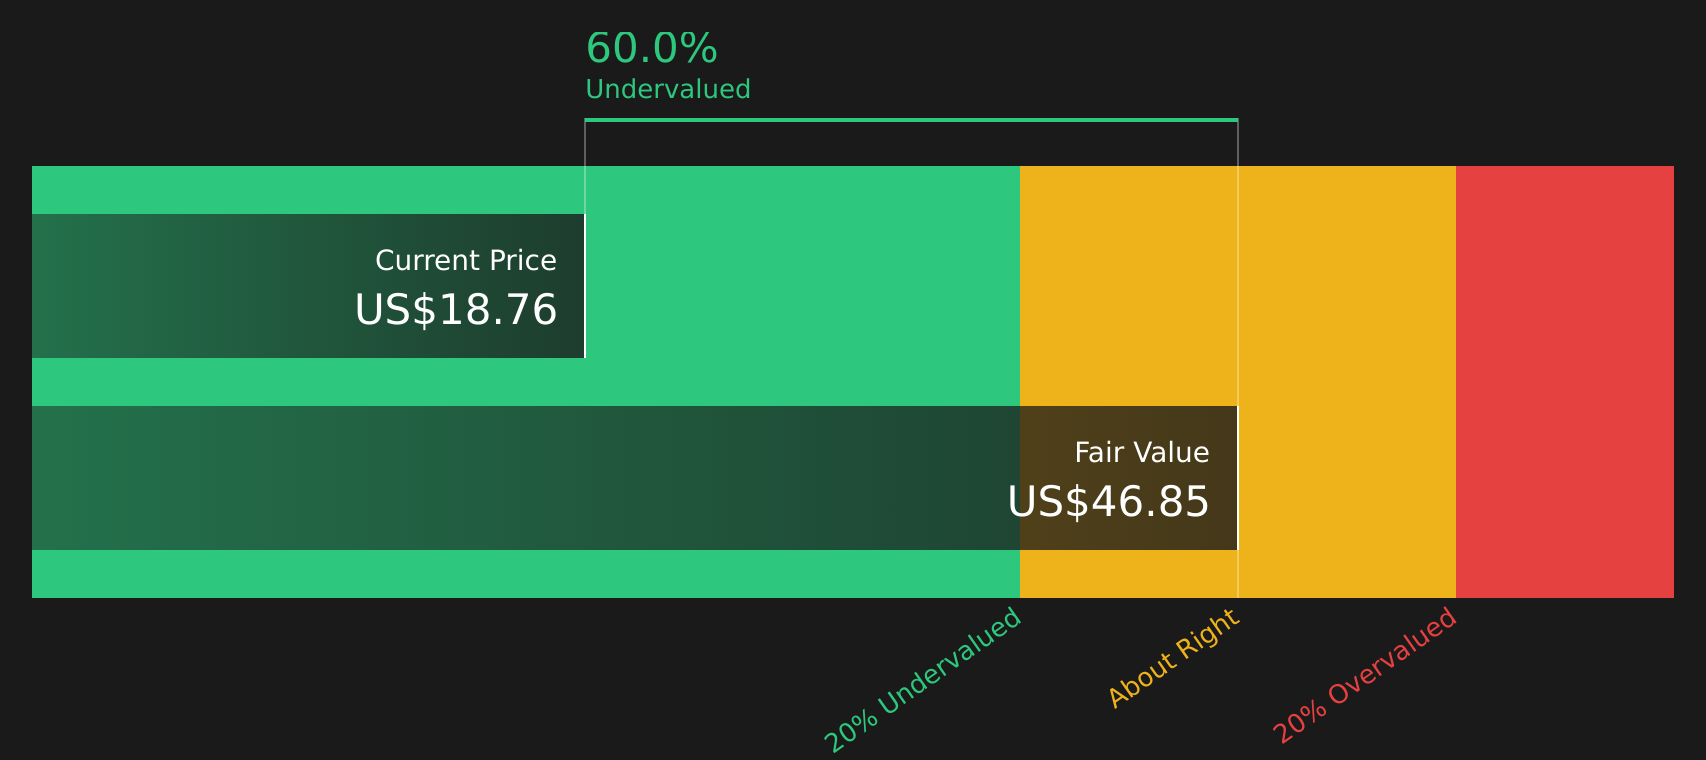
With Energy Transfer trading at US$19.04 alongside an indicated intrinsic discount of 59% and a value score of 5, the real question is whether this reflects a genuine mispricing or if the market is already accounting for future growth.
Price-to-Earnings of 15.9x: Is it justified?
Energy Transfer is trading on a P/E of 15.9x, compared with a peer average of 18.8x and a US Oil and Gas industry average of 14x, so the stock screens as cheaper than peers but richer than the wider sector.
The P/E ratio compares the current unit price to earnings per unit and is a quick way to see how much investors are paying for each dollar of profit. For a large, diversified midstream partnership with multiple fee based businesses, P/E often reflects how reliable the market believes future earnings will be and how comfortable investors are with the balance between growth investments and distributions.
On one hand, Energy Transfer is described as good value versus the peer average and also versus an estimated fair P/E of 26x, a level the market could move towards if confidence in its earnings outlook strengthens. On the other hand, the current P/E is higher than the broader US Oil and Gas industry average, which suggests investors are already paying a premium compared with the sector despite commentary that dividend coverage and interest coverage are areas to watch.
Result: Price-to-Earnings of 15.9x (UNDERVALUED)
However, you also need to weigh risks like exposure to energy demand cycles and the partnership’s sizable capital needs, which could pressure earnings quality and distributions.
Another view on value: DCF vs earnings multiple
The SWS DCF model presents a stronger value case than the 15.9x P/E suggests. With Energy Transfer at $19.04 and an indicated future cash flow value of $46.84, the units are described as trading well below that estimate. This raises a simple question: is the market underpricing long term cash flows, or is the model too generous?
Simply Wall St performs a discounted cash flow (DCF) on every stock in the world every day (check out Energy Transfer for example). We show the entire calculation in full. You can track the result in your watchlist or portfolio and be alerted when this changes, or use our stock screener to discover 47 high quality undervalued stocks. If you save a screener we even alert you when new companies match - so you never miss a potential opportunity.
Next Steps
Mixed signals or a clear message: the data on Energy Transfer points to both concerns and optimism, so review the numbers now and weigh the 3 key rewards and 2 important warning signs
Looking for more investment ideas?
If you stop with just one stock, you risk missing out on other opportunities that might fit your goals even better, so take a few minutes to scan wider.
- Target companies that combine quality with attractive pricing by reviewing the 47 high quality undervalued stocks.
- Strengthen your income focus by checking out the 9 dividend fortresses.
- Reduce portfolio stress by considering stocks in the 63 resilient stocks with low risk scores.
This article by Simply Wall St is general in nature. We provide commentary based on historical data and analyst forecasts only using an unbiased methodology and our articles are not intended to be financial advice. It does not constitute a recommendation to buy or sell any stock, and does not take account of your objectives, or your financial situation. We aim to bring you long-term focused analysis driven by fundamental data. Note that our analysis may not factor in the latest price-sensitive company announcements or qualitative material. Simply Wall St has no position in any stocks mentioned.