

Assessing Fannie Mae (OTCPK:FNMA) Valuation After Mixed Recent Share Price Performance
FEDERAL NATIONAL MORTGAGE ASSOC FNMA | 0.00 |
Recent Performance Snapshot
Federal National Mortgage Association (FNMA) has drawn investor interest after recent trading that left the stock near $8.15, with returns mixed across the past week, month and past 3 months.
The recent 16.6% 7 day share price return, set against a year to date share price decline of 25.91% and a very large 3 year total shareholder return, suggests momentum has picked up in the short term while the longer term story remains dominated by earlier gains.
If this kind of sharp move has you thinking about where else capital is shifting, it could be a good moment to scan opportunities using our 18 top founder-led companies
With FNMA trading at $8.15 against an analyst price target of $12.90 and an intrinsic value estimate that suggests a sizeable discount, the key question is whether this is a genuine opportunity or whether the market is already pricing in future growth.
Preferred Multiple of 1.7x Price-to-Sales: Is it justified?
FNMA screens as good value compared with peers, with a P/S ratio of 1.7x against both the US Diversified Financial industry average of 2.3x and a peer average of 4.1x.
The P/S ratio compares the company’s market value to its revenue, so a lower figure can indicate that each dollar of sales is being priced more conservatively by the market.
Here, the gap is wide. FNMA not only trades below industry and peer averages, it also sits well under an estimated fair P/S ratio of 5x that our regression work suggests the market could move towards if sentiment or fundamentals align more closely with peers.
Result: Price-to-Sales of 1.7x
However, you also need to weigh risks such as earnings sensitivity to US housing and the impact of any shifts in mortgage credit performance or policy.
Another View: Cash Flow Points To A Steeper Discount
While the current 1.7x P/S ratio suggests FNMA is priced below peers, the SWS DCF model paints an even starker picture. With the share price at $8.15 against an estimated future cash flow value of $50.91, the gap is wide enough to prompt closer scrutiny of every assumption behind both views.
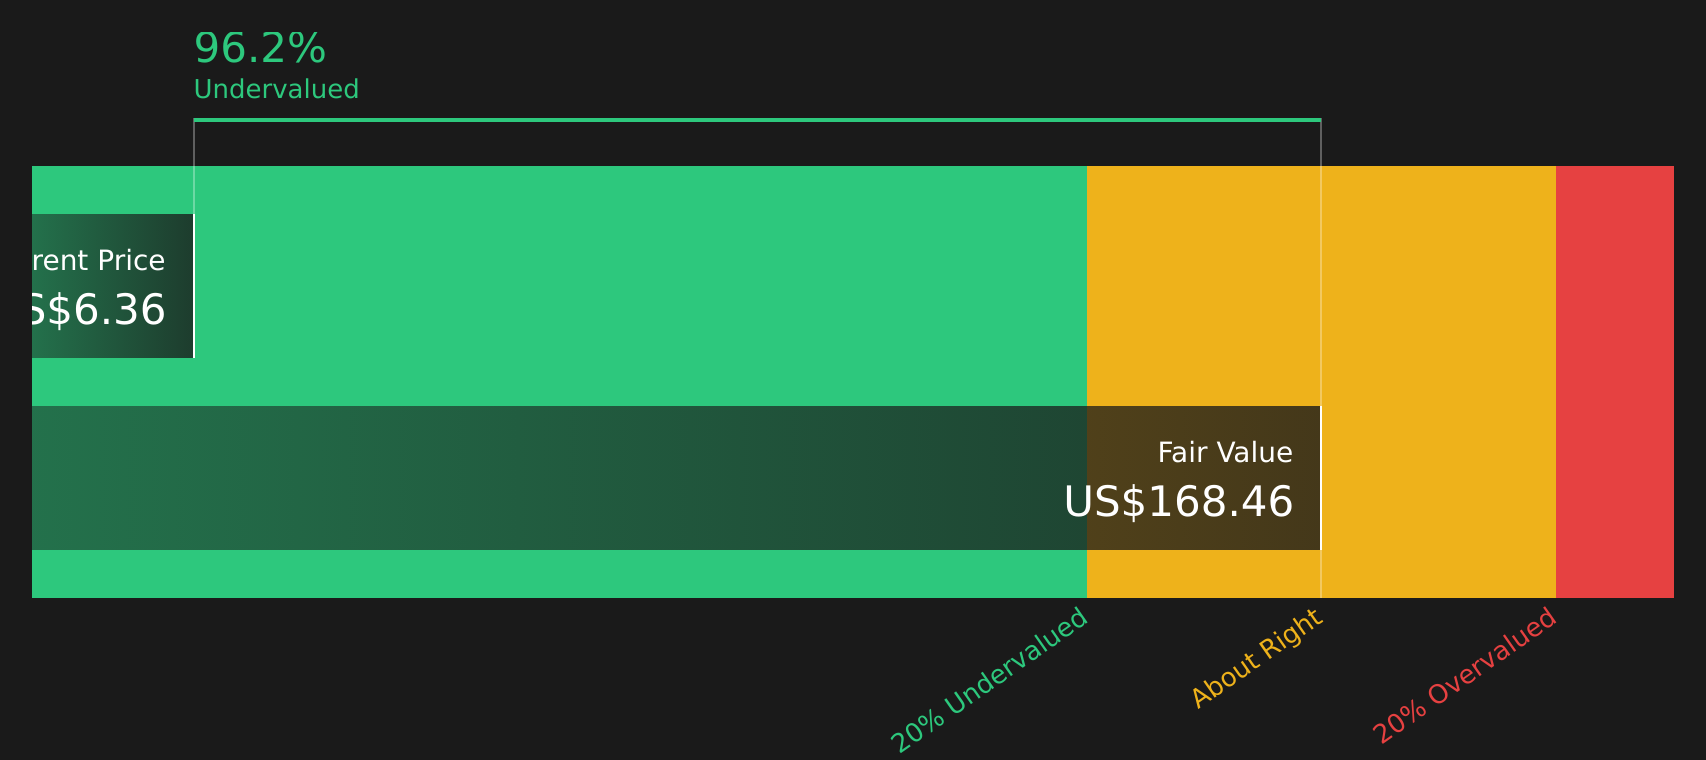
Simply Wall St performs a discounted cash flow (DCF) on every stock in the world every day (check out Federal National Mortgage Association for example). We show the entire calculation in full. You can track the result in your watchlist or portfolio and be alerted when this changes, or use our stock screener to discover 51 high quality undervalued stocks. If you save a screener we even alert you when new companies match - so you never miss a potential opportunity.
Next Steps
With sentiment clearly split between potential upside and the risks on the table, now is the time to weigh the evidence yourself and move with conviction. Start by sizing up the 3 key rewards and 2 important warning signs.
Looking for more investment ideas?
If you stop with just one stock, you could miss some of the most interesting setups on the market. Use a targeted screener to widen your options.
- Spot potential value plays early by tracking companies that show up in the screener containing 25 high quality undiscovered gems before they are widely followed.
- Strengthen your core holdings by focusing on companies highlighted through the solid balance sheet and fundamentals stocks screener (44 results) that pair resilience with fundamentals.
- Reduce portfolio stress by seeking out candidates in the 67 resilient stocks with low risk scores that screen well on stability and risk scores.
This article by Simply Wall St is general in nature. We provide commentary based on historical data and analyst forecasts only using an unbiased methodology and our articles are not intended to be financial advice. It does not constitute a recommendation to buy or sell any stock, and does not take account of your objectives, or your financial situation. We aim to bring you long-term focused analysis driven by fundamental data. Note that our analysis may not factor in the latest price-sensitive company announcements or qualitative material. Simply Wall St has no position in any stocks mentioned.