Assessing First Bancorp (FBNC) Valuation After Dividend Increase And Boardroom Change
First Bancorp FBNC | 55.87 | -0.94% |
Why this dividend move and board change matter for First Bancorp (FBNC)
First Bancorp (FBNC) has drawn fresh attention after its board approved a higher quarterly cash dividend and announced the retirement of long serving director and former board chair Mary Clara Capel.
Those boardroom and dividend updates come after a strong run in the shares, with a 30 day share price return of 15.97% and a 1 year total shareholder return of 44.36%, suggesting momentum has been building recently.
If you are looking beyond regional banks for what could be moving next, this is a good moment to scan our list of 22 top founder-led companies.
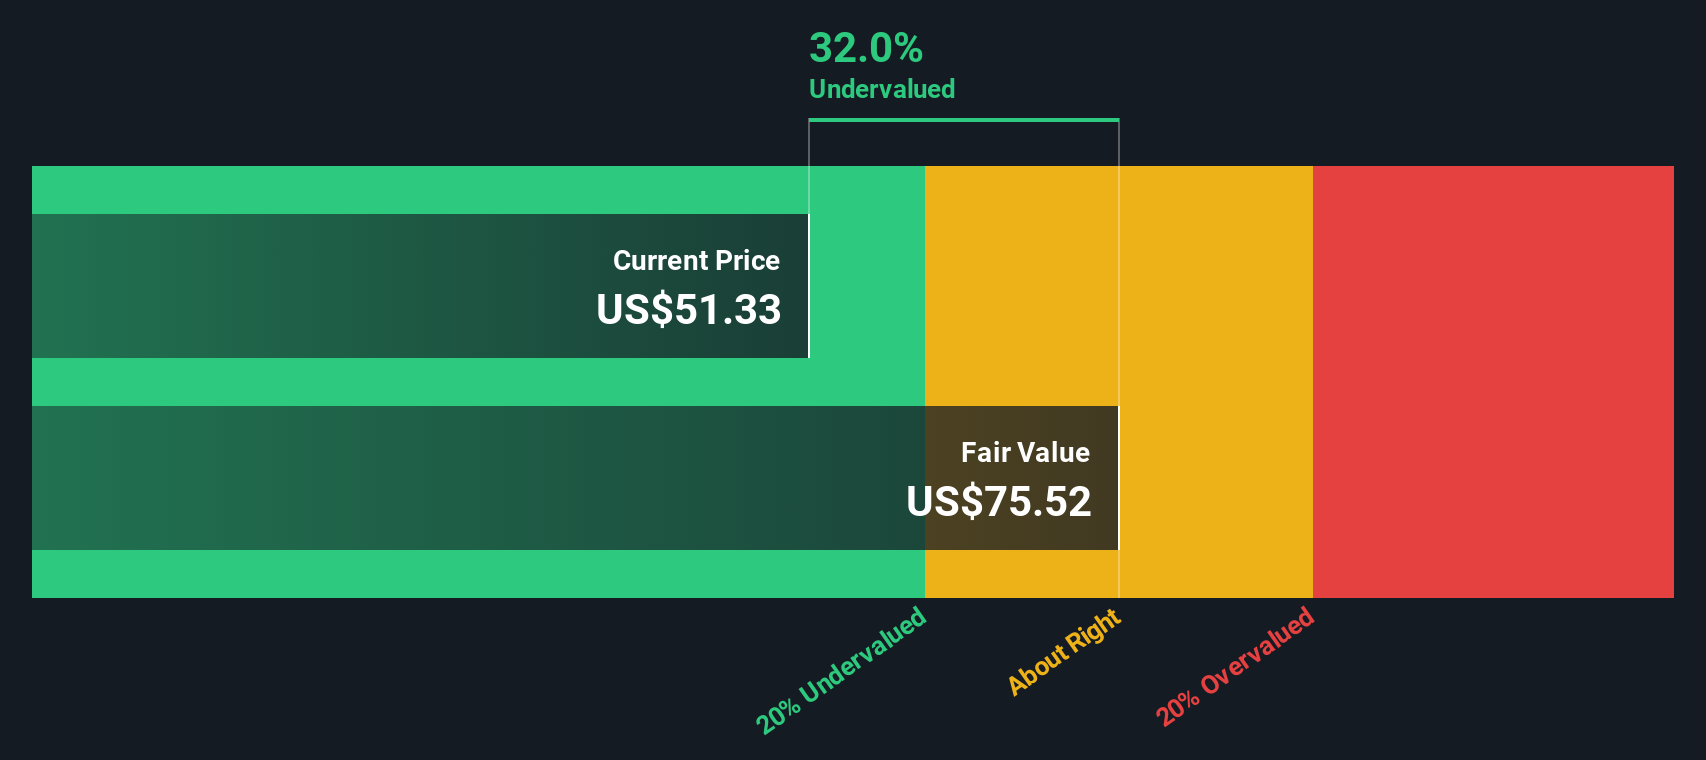
With FBNC up 44.36% over the past year and trading at a 35.72% intrinsic discount estimate, the key question now is whether there is still a buying opportunity here or if the market is already pricing in future growth.
Preferred P/E of 23.2x: Is it justified?
On a headline view, First Bancorp's current P/E of 23.2x sits well above both the US banks industry average of 12x and its peer group average of 12.8x, even though the share price last closed at $62.23 and is assessed as trading at a 35.7% discount to an estimated fair value based on future cash flows.
The P/E multiple compares the current share price with earnings per share, so a higher ratio usually means investors are paying more today for each dollar of earnings. For a regional bank like First Bancorp, that can reflect expectations around earnings growth, the reliability of its profit stream, or confidence in its balance sheet and management. The SWS DCF model, which estimates a fair value of $96.81 by projecting future cash flows and discounting them back to today, suggests the market price does not fully align with those cash flow based assumptions.
FBNC's earnings grew 46.5% over the past year and are described as high quality, with current net profit margins of 29.3% compared with 22.7% last year. Forecasts also point to annual earnings growth of 28.2%, faster than the wider US market, and revenue growth of 17.5% per year, ahead of the US market as well. Set against that, the current 6.7% return on equity is considered low and is expected to remain below 20% in three years, which can limit how far the P/E multiple might stretch if profitability does not move closer to higher returning peers. Overall, the present 23.2x P/E stands well above both the industry and peer averages and above the estimated fair P/E of 16.3x. This is a level the market could gravitate toward if sentiment or growth expectations cool.
Result: Price-to-Earnings of 23.2x (OVERVALUED)
However, you still have to weigh risks, such as a relatively low 6.7% return on equity and the possibility that high growth expectations embedded in a 23.2x P/E ease off.
Another view from cash flows
While the 23.2x P/E hints at an expensive stock, our DCF model presents a different perspective. It shows First Bancorp at $62.23 compared with an estimated future cash flow value of $96.81, implying a 35.7% discount. If earnings hold up, is the market being too cautious here?
Simply Wall St performs a discounted cash flow (DCF) on every stock in the world every day (check out First Bancorp for example). We show the entire calculation in full. You can track the result in your watchlist or portfolio and be alerted when this changes, or use our stock screener to discover 52 high quality undervalued stocks. If you save a screener we even alert you when new companies match - so you never miss a potential opportunity.
Build Your Own First Bancorp Narrative
If you see the numbers differently or prefer to rely on your own work, you can quickly shape a view that fits your thesis, Do it your way.
A great starting point for your First Bancorp research is our analysis highlighting 4 key rewards and 1 important warning sign that could impact your investment decision.
Looking for more investment ideas?
If you stop with just one stock, you could miss other opportunities that fit your style, so use these screeners to widen your watchlist with purpose.
- Target value opportunities that match your standards by checking companies on our 52 high quality undervalued stocks list built from fundamental data.
- Lock in potential income ideas by reviewing companies in our 14 dividend fortresses that focus on higher yielding payouts.
- Prioritise resilience and sleep easier at night with companies filtered through our 82 resilient stocks with low risk scores focused on lower risk scores.
This article by Simply Wall St is general in nature. We provide commentary based on historical data and analyst forecasts only using an unbiased methodology and our articles are not intended to be financial advice. It does not constitute a recommendation to buy or sell any stock, and does not take account of your objectives, or your financial situation. We aim to bring you long-term focused analysis driven by fundamental data. Note that our analysis may not factor in the latest price-sensitive company announcements or qualitative material. Simply Wall St has no position in any stocks mentioned.