Assessing FirstEnergy (FE) Valuation As Recent Gains Meet Conflicting Fair Value Narratives
FirstEnergy Corp. FE | 51.31 | +0.69% |
Event context and recent stock performance
FirstEnergy (FE) shares moved about 1% in the latest session, continuing a mixed recent run that includes a small weekly decline along with positive moves over the past month and past 3 months.
At a share price of US$46.99, FirstEnergy’s recent 1-day share price return of 1.27% sits alongside a 30-day share price return of 4.79% and a 1-year total shareholder return of 23.17%. This indicates that momentum has been building over the past year.
If this kind of steady utility performance has your attention, it could be a good moment to broaden your watchlist with our nuclear energy infrastructure stock ideas via 87 nuclear energy infrastructure stocks.
With FirstEnergy delivering a 23.17% 1-year total shareholder return and trading at US$46.99 versus an average analyst target of US$50.23, you have to ask: is there still real upside here or is future growth already priced in?
Most Popular Narrative: 6% Undervalued
With FirstEnergy closing at $46.99 against a widely followed fair value of $50, the current price sits below where the leading narrative thinks the numbers add up.
Large-scale infrastructure modernization and grid hardening initiatives including the $28 billion investment plan through 2029 and a 15% CAGR in transmission rate base enable higher returns on equity, improved reliability, and ultimately enhance net margins and earnings growth.
Curious what kind of revenue path and margin profile would justify that fair value and future earnings step up? The narrative leans on measured growth, thicker profitability and a future earnings multiple that edges below where the wider electric utilities group sits today. The full story connects these moving parts into one valuation roadmap.
Result: Fair Value of $50 (UNDERVALUED)
However, legal and regulatory overhang from past scandals, as well as the heavy, long term capital spend required for grid upgrades, could challenge the optimistic earnings path investors are watching.
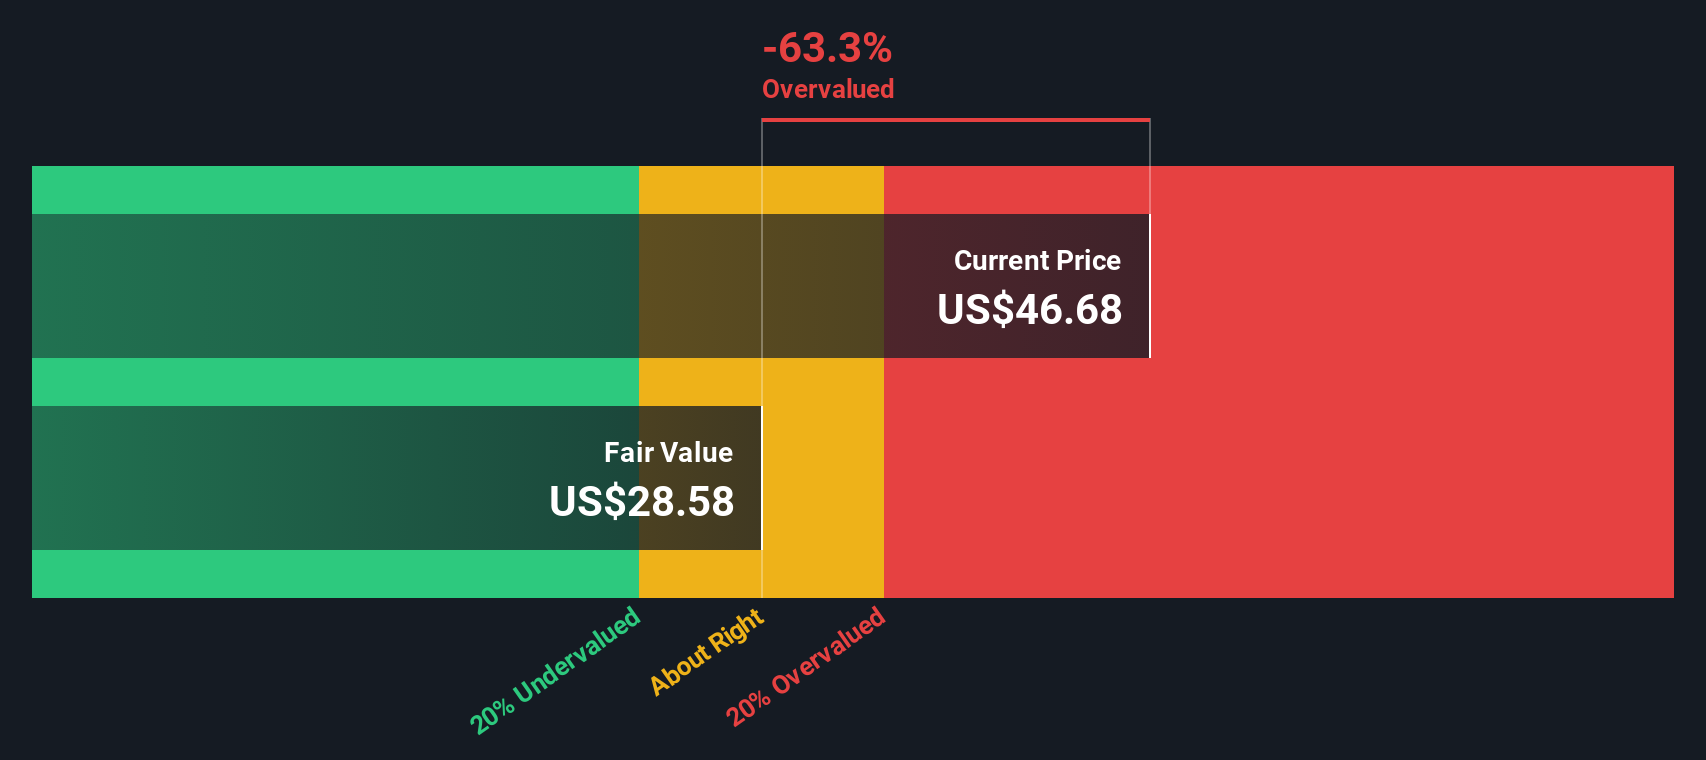
Another View: Cash Flows Paint a Tougher Picture
While the popular narrative sees FirstEnergy as about 6% undervalued around $47 versus a US$50 fair value, our DCF model lands in a very different place, at roughly $29 per share. On this view, the stock screens as expensive, not cheap. This raises a simple question: which story do you trust more, cash flows or multiples?
Simply Wall St performs a discounted cash flow (DCF) on every stock in the world every day (check out FirstEnergy for example). We show the entire calculation in full. You can track the result in your watchlist or portfolio and be alerted when this changes, or use our stock screener to discover 55 high quality undervalued stocks. If you save a screener we even alert you when new companies match - so you never miss a potential opportunity.
Build Your Own FirstEnergy Narrative
If you look at these numbers and reach a different conclusion, or simply prefer to test your own assumptions directly, you can build a custom FirstEnergy story for yourself in just a few minutes, starting with Do it your way.
A great starting point for your FirstEnergy research is our analysis highlighting 3 key rewards and 2 important warning signs that could impact your investment decision.
Looking for more investment ideas?
You have already put in the work on FirstEnergy, so do not stop there. Use the same clear data to spot other opportunities that fit your style.
- Target value-focused opportunities by scanning 55 high quality undervalued stocks that combine quality fundamentals with prices that look appealing on key metrics.
- Prioritise staying power by reviewing solid balance sheet and fundamentals stocks screener (46 results) and focusing on companies with balance sheets that may handle tougher conditions more comfortably.
- Hunt for lesser known potential by filtering through our screener containing 25 high quality undiscovered gems where strong fundamentals have not yet attracted broad attention.
This article by Simply Wall St is general in nature. We provide commentary based on historical data and analyst forecasts only using an unbiased methodology and our articles are not intended to be financial advice. It does not constitute a recommendation to buy or sell any stock, and does not take account of your objectives, or your financial situation. We aim to bring you long-term focused analysis driven by fundamental data. Note that our analysis may not factor in the latest price-sensitive company announcements or qualitative material. Simply Wall St has no position in any stocks mentioned.