Assessing FLEX LNG (FLNG) Valuation After Weaker Earnings And A New Dividend Declaration
FLEX LNG LTD (BM) FLNG | 30.47 | +3.99% |
FLEX LNG (FLNG) is in focus after reporting weaker fourth quarter and full year 2025 earnings, along with a fresh dividend declaration, a mix that raises practical questions about how its cash generation supports shareholder payouts.
The recent earnings miss and fresh dividend come after a period of steady share price momentum, with an 11.43% year to date share price return and a 28.76% total shareholder return over the past year. This suggests income focused investors are still engaged despite softer profits.
If this mix of income and price gains has you thinking about where else to put capital to work, it could be worth scanning our screener of 22 top founder-led companies for other long term growth stories.
With the share price up and the latest dividend held at US$0.75 per share despite weaker earnings, the key question now is whether FLEX LNG still offers value or if the market is already pricing in future growth.
Most Popular Narrative: 4.9% Overvalued
With FLEX LNG trading at $27.49 against a widely followed fair value estimate of $26.20, investors are weighing a small premium against a tightly modeled outlook.
The company's multi-year contract backlog (56 years minimum, up to 85 years with options) and long-term charters secure steady revenue and earnings despite short-term market softness, positioning FLEX LNG to benefit as global LNG trade volumes are projected to rise due to new export capacity coming online, particularly from the US, Qatar, and Africa, boosting future cash flow visibility and net margin stability.
Want to see what is baked into that fair value? The narrative leans heavily on contract coverage, margin expansion and a tighter earnings multiple. The exact mix of revenue assumptions, profit levels and discount rate does the heavy lifting. If you want to see how those moving parts fit together, the full narrative lays out every step.
Result: Fair Value of $26.20 (OVERVALUED)
However, that story could shift if the expected wave of new LNG vessels pressures charter rates or if high dividend payouts limit cash available for fleet renewal.
Another View: Big Gap Between Market Price And Cash Flow Model
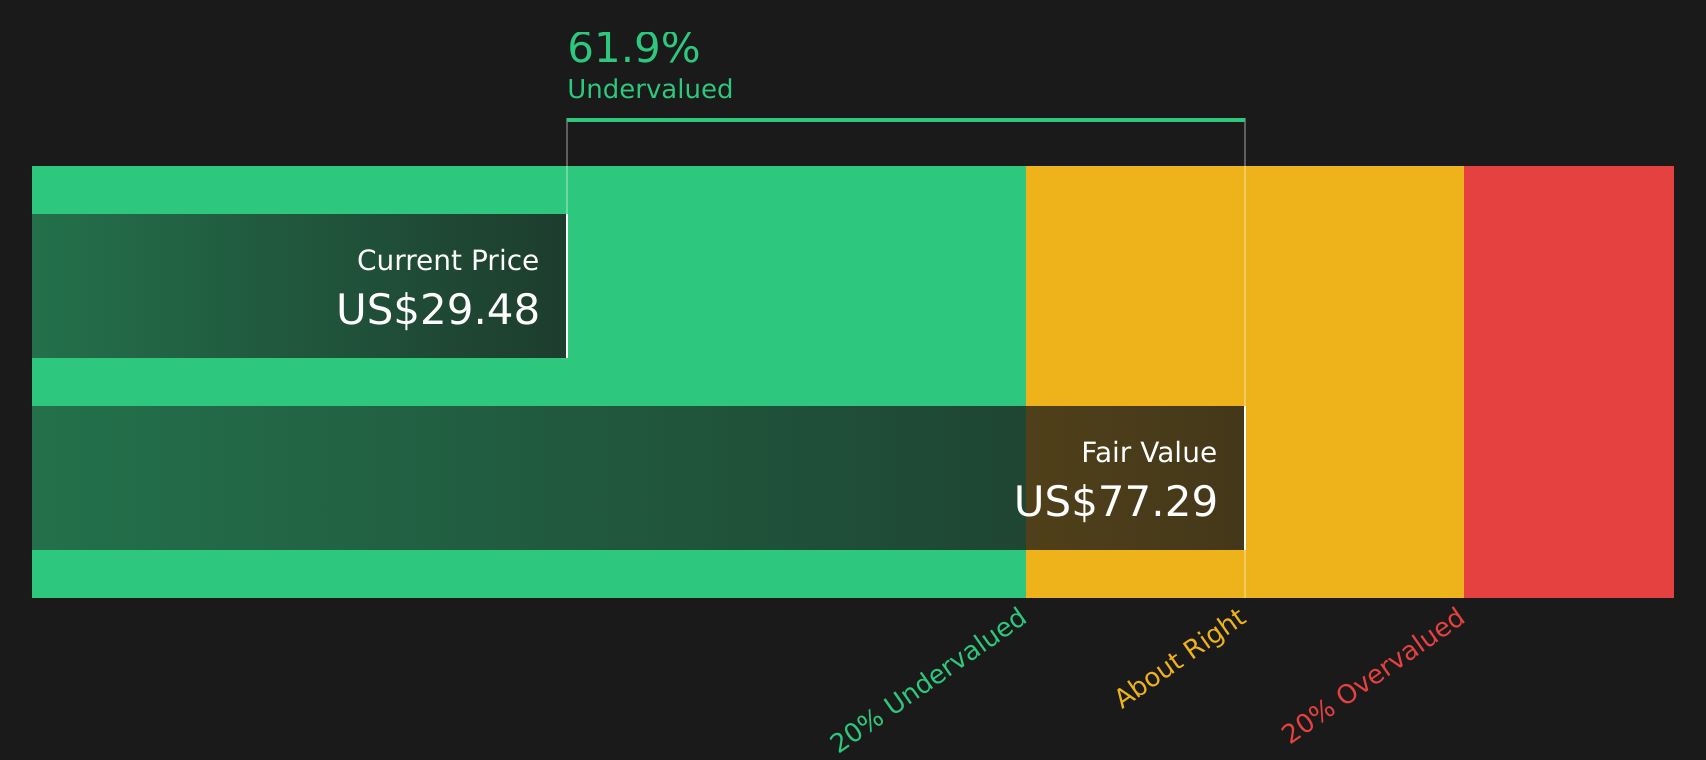
While the narrative-based fair value sits at US$26.20 with the shares at US$27.49, our DCF model points to a very different picture, with an estimated future cash flow value of US$89.11. That is a large gap, so which set of assumptions do you trust more?
Simply Wall St performs a discounted cash flow (DCF) on every stock in the world every day (check out FLEX LNG for example). We show the entire calculation in full. You can track the result in your watchlist or portfolio and be alerted when this changes, or use our stock screener to discover 54 high quality undervalued stocks. If you save a screener we even alert you when new companies match - so you never miss a potential opportunity.
Next Steps
With such a split view in the numbers and narratives, do you want to rely on others or test the story yourself? Our full breakdown of 2 key rewards and 3 important warning signs can help you weigh both sides before you decide how to act.
Ready to hunt for your next idea?
If FLEX LNG has you thinking more broadly about where to put fresh capital, do not stop here. Widen your search and pressure test new possibilities.
- Target reliability with a list of companies that have strong financial footing by checking out our solid balance sheet and fundamentals stocks screener (43 results) tailored for balance sheet strength.
- Chase value by comparing FLEX LNG to 54 high quality undervalued stocks that combine quality fundamentals with prices that may sit below their fair value estimates.
- Build a steadier income stream by lining up potential payers from our 15 dividend fortresses before the next round of ex dividend dates comes around.
This article by Simply Wall St is general in nature. We provide commentary based on historical data and analyst forecasts only using an unbiased methodology and our articles are not intended to be financial advice. It does not constitute a recommendation to buy or sell any stock, and does not take account of your objectives, or your financial situation. We aim to bring you long-term focused analysis driven by fundamental data. Note that our analysis may not factor in the latest price-sensitive company announcements or qualitative material. Simply Wall St has no position in any stocks mentioned.