

Assessing Freeport-McMoRan (FCX) After 69% One-Year Surge And Copper Supply Focus
Freeport-McMoRan, Inc. FCX | 0.00 |
- If you are wondering whether Freeport-McMoRan's current share price gives you good value for your money, this article walks through what the numbers actually say about the stock.
- The shares recently closed at US$61.17, with returns of 4.2% over 7 days, 15.3% over 30 days, 17.8% year to date, 69.1% over 1 year, 45.0% over 3 years and 132.1% over 5 years.
- Recent news around Freeport-McMoRan has focused on its position as a major copper and gold producer and how investors are thinking about its role in long term resource supply. That context has helped shape how the market is reacting to the stock's recent price moves and what investors are willing to pay today.
- On our valuation checks, Freeport-McMoRan currently scores 2 out of 6. That raises some clear questions about where value is and is not showing up in the usual models, and sets us up to compare standard valuation approaches with a more rounded way of thinking about the stock later in the article.
Freeport-McMoRan scores just 2/6 on our valuation checks. See what other red flags we found in the full valuation breakdown.
Approach 1: Freeport-McMoRan Discounted Cash Flow (DCF) Analysis
A Discounted Cash Flow, or DCF, model takes estimates of the cash a company could generate in the future and discounts those cash flows back to today to arrive at an estimate of what the business might be worth right now.
For Freeport-McMoRan, the model used is a 2 Stage Free Cash Flow to Equity approach, based on cash flow projections in $. The latest twelve month free cash flow is about $678.0m. Analysts provide forecasts for several years ahead and, beyond that, Simply Wall St extends the projections. For example, projected free cash flow reaches $9.8b by 2030, with intermediate years such as 2026 and 2027 sitting in the low to mid single digit billions of $.
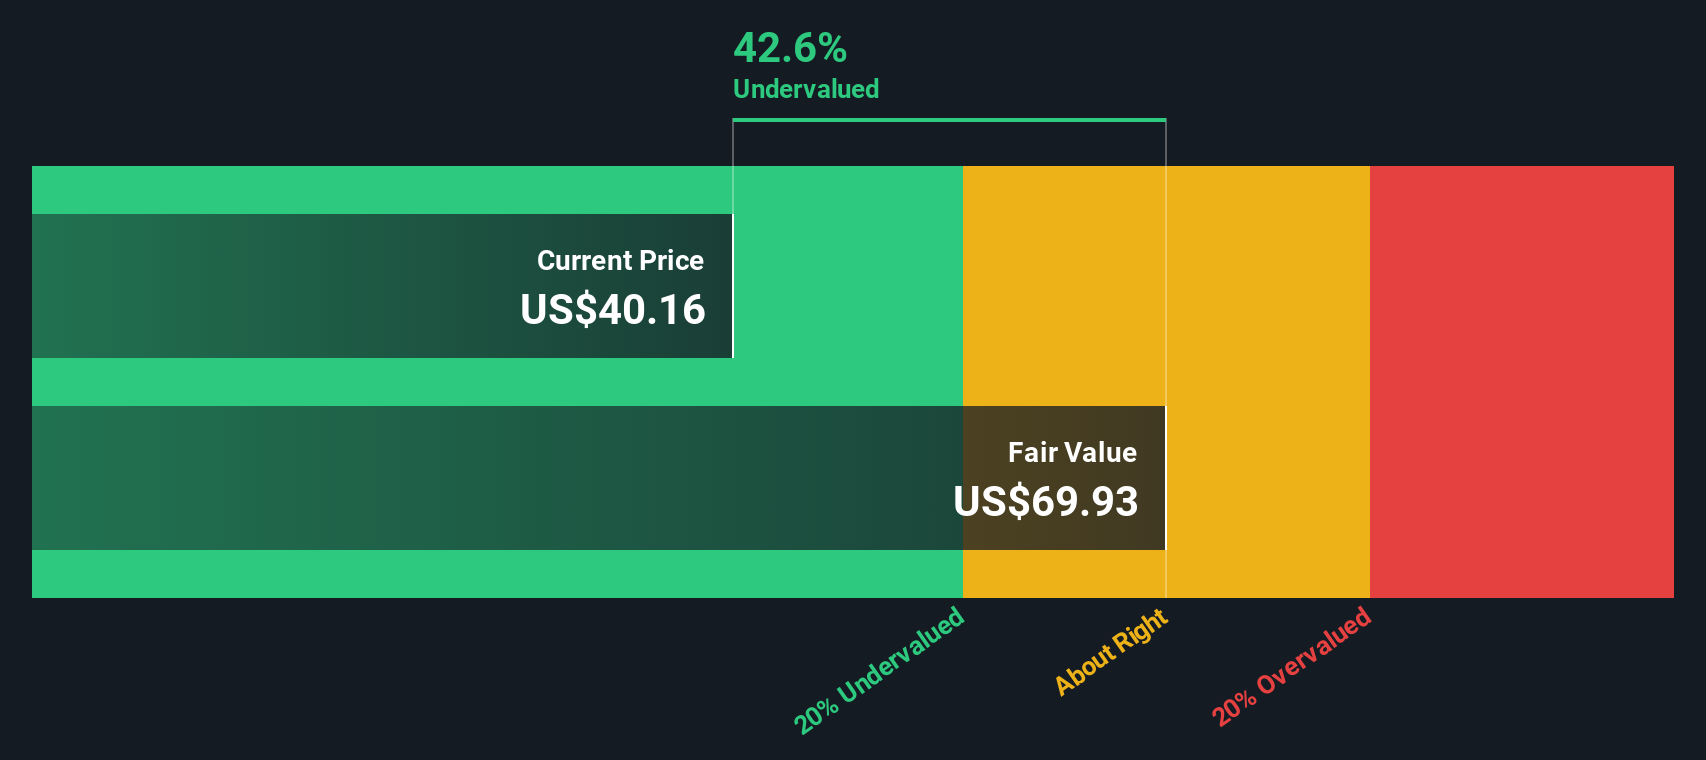
When all of those forecast cash flows are discounted back and summed, the model arrives at an estimated intrinsic value of US$109.39 per share. Compared with the recent share price of US$61.17, this implies the stock is 44.1% undervalued on this DCF view.
Result: UNDERVALUED
Our Discounted Cash Flow (DCF) analysis suggests Freeport-McMoRan is undervalued by 44.1%. Track this in your watchlist or portfolio, or discover 888 more undervalued stocks based on cash flows.
Approach 2: Freeport-McMoRan Price vs Earnings
For a profitable company, the P/E ratio is a useful way to see what price the market is putting on each dollar of current earnings. It gives you a quick read on how optimistic or cautious investors are about those earnings compared with other options.
What counts as a "normal" or "fair" P/E depends on both growth expectations and risk. Higher expected earnings growth or lower perceived risk can support a higher P/E, while more uncertain prospects usually go with a lower P/E.
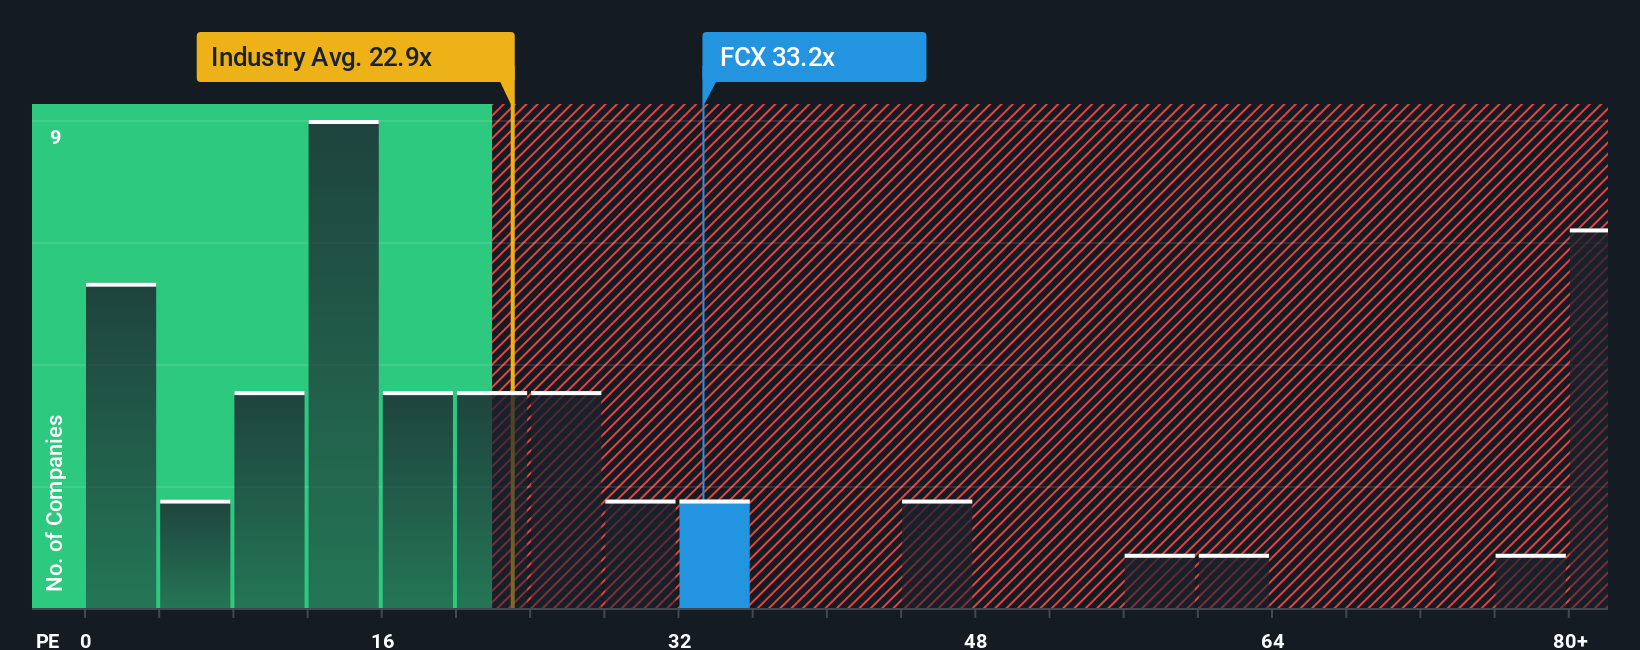
Freeport-McMoRan is currently trading on a P/E of 39.85x. That sits above the Metals and Mining industry average of about 26.00x, and also above the peer group average of 30.04x. On those simple comparisons, the shares look more expensive than many peers.
Simply Wall St also calculates a proprietary “Fair Ratio” for each stock. For Freeport-McMoRan, this Fair Ratio is 25.92x, which reflects factors such as its earnings growth profile, industry, profit margins, market cap and company specific risks. Because it blends these into a single figure, it can be more tailored than just lining the stock up against broad industry or peer averages.
Comparing the current P/E of 39.85x with the Fair Ratio of 25.92x suggests the shares are pricing in more optimism than the model implies.
Result: OVERVALUED
P/E ratios tell one story, but what if the real opportunity lies elsewhere? Discover 1425 companies where insiders are betting big on explosive growth.
Upgrade Your Decision Making: Choose your Freeport-McMoRan Narrative
Earlier we mentioned that there is an even better way to understand valuation, so let us introduce you to Narratives, which let you attach a clear story to your numbers by linking your view of Freeport-McMoRan’s future revenue, earnings and margins to a fair value estimate.
On Simply Wall St’s Community page, used by millions of investors, a Narrative is your own storyline for the company, connected directly to a financial forecast and a fair value, so you can compare that fair value with the current share price and decide whether the gap looks attractive enough to consider buying or selling.
Narratives are updated as new information comes in, such as fresh earnings releases or news. This means your view of Freeport-McMoRan does not stay static but adjusts automatically as the facts change and your forecast is refreshed.
For example, one Freeport-McMoRan Narrative might assume relatively optimistic revenue growth and higher profit margins and arrive at a much higher fair value. Another could take a more cautious view on growth and margins and reach a much lower fair value, showing how different investors can look at the same stock and reach very different conclusions.
Do you think there's more to the story for Freeport-McMoRan? Head over to our Community to see what others are saying!

This article by Simply Wall St is general in nature. We provide commentary based on historical data and analyst forecasts only using an unbiased methodology and our articles are not intended to be financial advice. It does not constitute a recommendation to buy or sell any stock, and does not take account of your objectives, or your financial situation. We aim to bring you long-term focused analysis driven by fundamental data. Note that our analysis may not factor in the latest price-sensitive company announcements or qualitative material. Simply Wall St has no position in any stocks mentioned.