Assessing HCI Group (HCI) Valuation After Recent Share Price Volatility
HCI Group, Inc. HCI | 153.09 | -0.55% |
HCI Group (HCI) has drawn attention after recent share price swings, with the stock showing mixed returns across the past week, month, and past 3 months. This has prompted investors to reassess its current valuation.
The recent 1-day share price return of 1.22% and 7-day share price return of 5.45% come after a weaker patch, with the 30-day and year-to-date share price returns both around a 10% decline. At the same time, the 1-year total shareholder return of 39.21% and 3-year total shareholder return of around 2.4x highlight that, despite recent weakness, longer term momentum has been strong as investors reassess both growth potential and risk around the current US$164.77 share price.
If you are looking beyond insurance to see what else is moving, this could be a good moment to broaden your search with 22 top founder-led companies.
So with HCI Group trading at US$164.77 alongside an indicated intrinsic discount of around 76% and a large gap to the US$245 analyst target, is this a genuine opportunity, or is the market already pricing in future growth?
Most Popular Narrative: 18.8% Overvalued
According to the most followed narrative, HCI Group's fair value of $138.75 sits below the recent $164.77 share price. This frames the current debate around upside and downside.
The dividend is well covered by both earnings (13% earnings payout ratio) and cash flows (5% cash payout ratio).
The dividend has increased by an average of 4.8% per year over the past 10 years and has been stable with no material reductions to payments, indicating a long track record of dividend growth and stability.
According to BenFranklin1776, this valuation rests on a mix of resilient margins, measured dividend growth and an earnings outlook that underpins a premium to pure book value. Curious which profit and growth assumptions sit behind that $138.75 figure and why they point to an overvaluation gap at today's price? The full narrative explains those moving parts in plain terms.
Result: Fair Value of $138.75 (OVERVALUED)
However, this view could be challenged if insurance margins compress toward the 9.58% industry level, or if the annual revenue growth rate of 13.41% fails to persist.
Another View: Multiples Point To Value Support
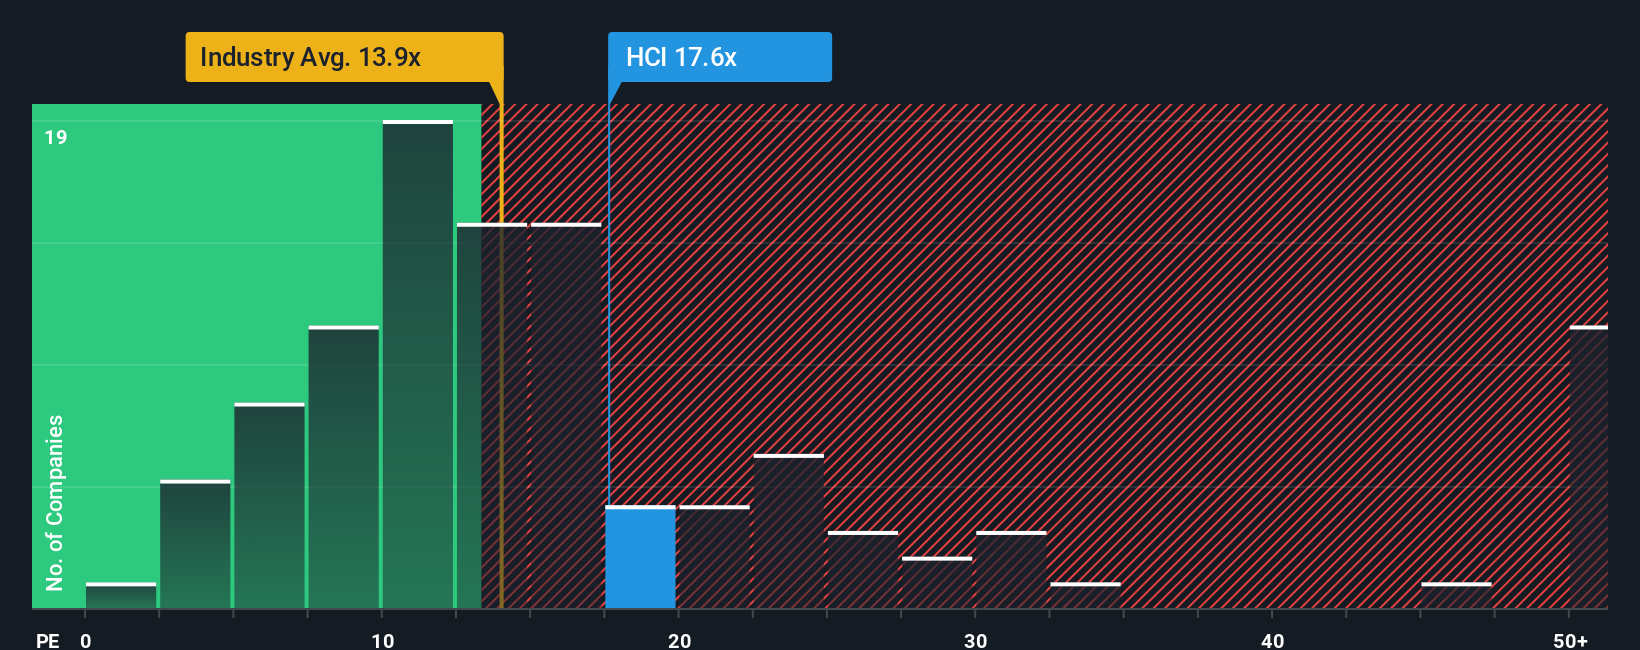
While the most followed narrative pegs fair value at $138.75 and calls HCI Group overvalued, the P/E of 10.8x tells a different story. It sits below both the US Insurance industry at 12.6x and peers at 32.4x, and only slightly under our fair ratio of 11.6x. This suggests the market may not be pricing in excessive optimism at today’s level. So is the tension here really about price, or about how much earnings power you think is repeatable?
Build Your Own HCI Group Narrative
If you are not fully convinced by these views or simply prefer to work from the raw numbers yourself, you can test the assumptions, adjust the inputs, and shape your own HCI Group thesis in just a few minutes with Do it your way.
A great starting point for your HCI Group research is our analysis highlighting 4 key rewards and 2 important warning signs that could impact your investment decision.
Looking for more investment ideas?
If you are serious about tightening up your portfolio, it makes sense to scan beyond a single stock and see what else fits your goals.
- Spot potential value opportunities early by checking companies our screener flags as 51 high quality undervalued stocks before the crowd pays closer attention.
- Strengthen your income stream by reviewing the reliable payers in our list of 13 dividend fortresses and see which yields actually look supported.
- Dial down portfolio stress by focusing on companies highlighted in our 85 resilient stocks with low risk scores, where our data points to more resilient risk profiles.
This article by Simply Wall St is general in nature. We provide commentary based on historical data and analyst forecasts only using an unbiased methodology and our articles are not intended to be financial advice. It does not constitute a recommendation to buy or sell any stock, and does not take account of your objectives, or your financial situation. We aim to bring you long-term focused analysis driven by fundamental data. Note that our analysis may not factor in the latest price-sensitive company announcements or qualitative material. Simply Wall St has no position in any stocks mentioned.