Assessing HealthEquity (HQY) Valuation After Fresh GARP-Focused Growth And Profitability Analysis
HealthEquity Inc HQY | 84.67 | +1.55% |
Why HealthEquity is back on GARP investors’ radar
Recent analysis placing HealthEquity (HQY) in the Growth at a Reasonable Price category has drawn renewed attention, as investors compare its earnings, revenue trends, profitability, and balance sheet with its recent share price performance.
HealthEquity’s recent share price performance has been mixed, with a 1-day share price return of 1.63% and a 7-day share price return of 2.04%. This contrasts with a 1-year total shareholder return decline of 21.07% and a 3-year total shareholder return gain of 43.33%. Together, these figures suggest that shorter term momentum has cooled while longer term holders have still seen meaningful value creation.
If HealthEquity’s profile has you thinking about healthcare more broadly, this could be a useful moment to scan for other opportunities across healthcare stocks and see what else fits your watchlist.
With annual revenue growth of 7.47%, net income growth of 18.96% and shares trading at a 45% discount to one intrinsic value estimate, is HealthEquity quietly undervalued, or is the market already pricing in the next leg of growth?
Most Popular Narrative: 26.9% Undervalued
HealthEquity’s most followed narrative pegs fair value at $119.13 versus a last close of $87.07, framing a sizable valuation gap that hinges on growth, margins and future cash flows.
The recent regulatory expansion allowing direct primary care, pre-deductible telehealth, and millions of new ACA bronze/catastrophic plan members to qualify for HSAs creates the largest addressable market increase in two decades, poised to accelerate new account openings and AUM growth, meaningfully boosting future revenue.
Curious what kind of revenue ramp, margin profile and future earnings multiple are baked into that fair value tag? The narrative leans on specific growth rates, higher profitability and a premium valuation that together need to line up almost perfectly. The full story spells out the assumptions, step by step, so you can decide if they stack up.
Result: Fair Value of $119.13 (UNDERVALUED)
However, the case can unravel if competition squeezes fees or if lower interest rates hit custodial yield harder than analysts currently factor in.
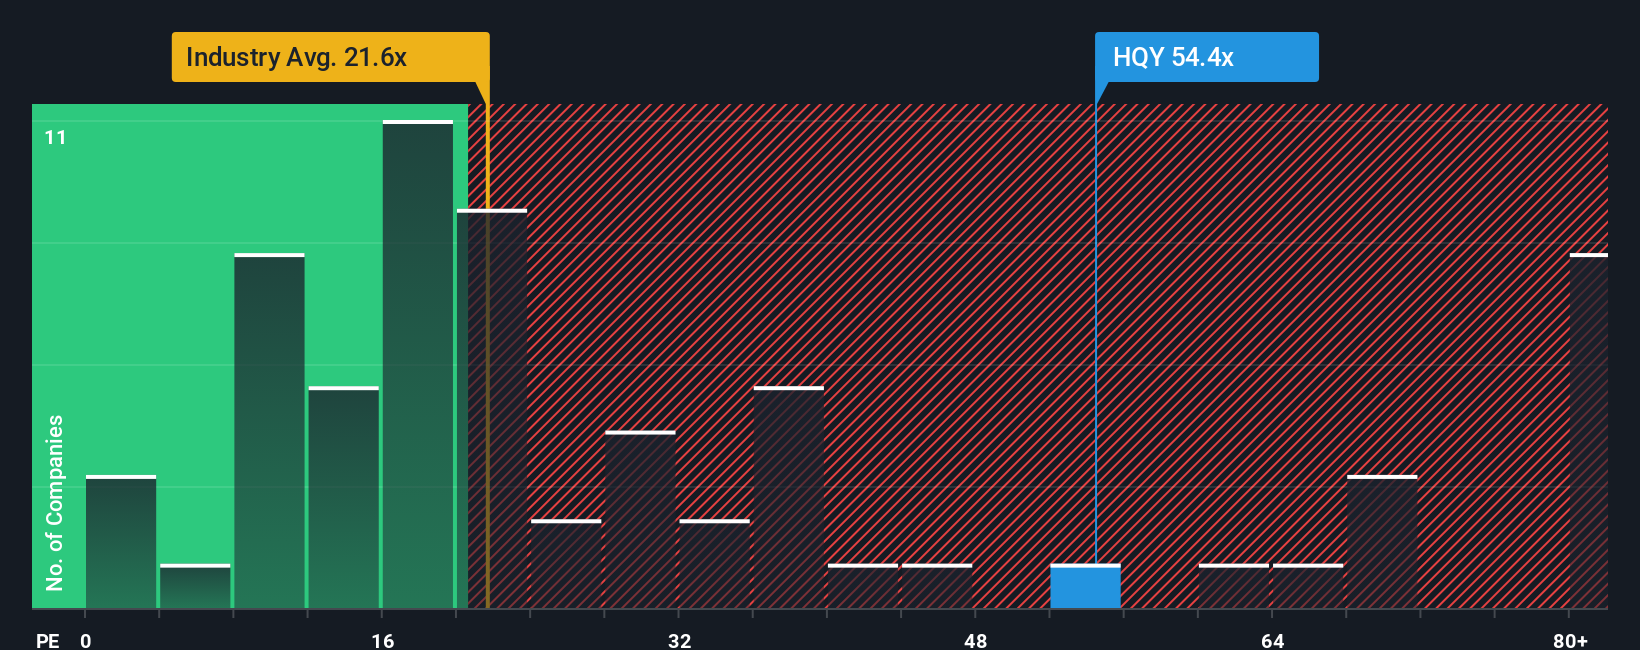
Another View: High P/E Puts Pressure On The Story
The SWS DCF model points to HealthEquity trading at a 45% discount to an estimated future cash flow value of $158.42, yet the market is already paying 38.8x P/E versus a fair ratio of 27x, a US Healthcare industry average of 22x and peers at 19.6x. If growth or margins land closer to those peers, how much room is there for the multiple to stay this rich?
Build Your Own HealthEquity Narrative
If you see the numbers differently or want to pressure test every assumption yourself, you can create your own view in minutes in Do it your way.
A great starting point for your HealthEquity research is our analysis highlighting 4 key rewards and 1 important warning sign that could impact your investment decision.
Ready to line up your next investment idea?
HealthEquity might be on your radar, but your next strong idea could be hiding in plain sight, and you do not want to miss it.
- Spot potential mispricings quickly by scanning these 876 undervalued stocks based on cash flows that appear cheap relative to their cash flows and fundamentals.
- Ride powerful technology shifts by checking out these 24 AI penny stocks that are tied to artificial intelligence themes.
- Add income candidates to your watchlist by focusing on these 13 dividend stocks with yields > 3% that currently offer yields above 3%.
This article by Simply Wall St is general in nature. We provide commentary based on historical data and analyst forecasts only using an unbiased methodology and our articles are not intended to be financial advice. It does not constitute a recommendation to buy or sell any stock, and does not take account of your objectives, or your financial situation. We aim to bring you long-term focused analysis driven by fundamental data. Note that our analysis may not factor in the latest price-sensitive company announcements or qualitative material. Simply Wall St has no position in any stocks mentioned.