Assessing Helix Energy Solutions Group (HLX) Valuation After Its Recent Share Price Strength
Helix Energy Solutions Group, Inc. HLX | 0.00 |
Why Helix Energy Solutions Group (HLX) is on investor radar
Helix Energy Solutions Group (HLX) has drawn attention after a strong run, with the stock showing positive returns over the past week, month and past 3 months. Investors are now weighing how its offshore services profile fits current energy demand trends.
At a share price of $10.29, Helix’s recent 30 day share price return of 9.82% and 90 day share price return of 29.60% build on a year to date share price return of 60.78%. The 1 year total shareholder return of 56.38% and 5 year total shareholder return of 102.56% point to steadily improving sentiment around its offshore services profile.
If you are watching how offshore energy service names are moving, it can also be useful to see which companies are powering the infrastructure behind that trend through 34 power grid technology and infrastructure stocks
With Helix trading at $10.29, alongside an indicated intrinsic discount of 33% and a 21% gap to the current analyst price target, the key question is whether value remains or if the market is already pricing in future growth.
Most Popular Narrative: 6% Overvalued
With Helix closing at $10.29 against a narrative fair value of $9.75, the current price sits slightly above that storyline, which leans heavily on contract momentum and decommissioning demand.
The pronounced long-term uptick in global demand for well abandonment, decommissioning, and offshore maintenance (as more aging fields require regulatory-compliant retirement) will expand Helix's core addressable market, supporting durable revenue growth, backlog expansion, and reduced earnings volatility.
Want to see what is built into that outlook? Revenue, margins, and valuation multiples are all wired into this narrative, with one assumption doing most of the heavy lifting.
Result: Fair Value of $9.75 (OVERVALUED)
However, this storyline only holds if project deferrals and spot market volatility do not deepen, and if rising vessel and labor costs do not compress margins further.
Another angle on value
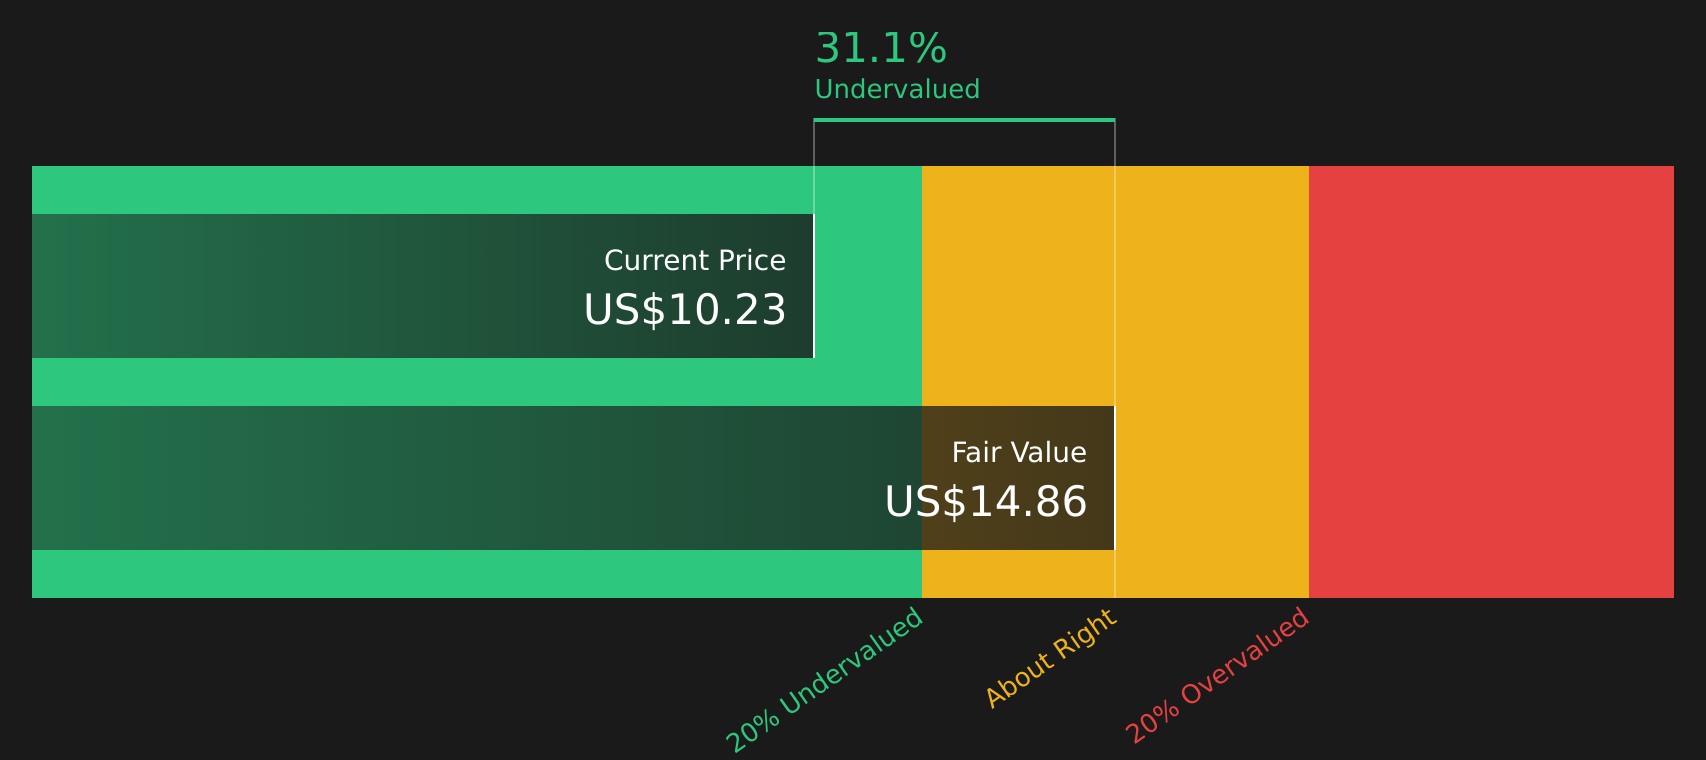
While the narrative fair value of $9.75 paints Helix as about 6% overvalued at $10.29, the SWS DCF model points the other way, with a future cash flow value estimate of $15.41. One method leans cautious and the other more optimistic. Which set of assumptions do you trust more?
Simply Wall St performs a discounted cash flow (DCF) on every stock in the world every day (check out Helix Energy Solutions Group for example). We show the entire calculation in full. You can track the result in your watchlist or portfolio and be alerted when this changes, or use our stock screener to discover 51 high quality undervalued stocks. If you save a screener we even alert you when new companies match - so you never miss a potential opportunity.
Next Steps
Mixed messages in the valuation and narrative can be useful, but the real advantage comes from testing the numbers yourself and forming a clear stance, starting with the 2 key rewards and 2 important warning signs
Looking for more investment ideas?
If Helix has your attention, do not stop there; broaden your watchlist now so you are not the one hearing about the best ideas after everyone else.
- Target resilient cash generators with lower volatility by scanning 67 resilient stocks with low risk scores, which can help anchor the more speculative parts of your portfolio.
- Spot potential mispricings early by reviewing screener containing 25 high quality undiscovered gems before they appear on every headline list.
- Strengthen your income stream by assessing 13 dividend fortresses that combine higher yields with disciplined payout profiles.
This article by Simply Wall St is general in nature. We provide commentary based on historical data and analyst forecasts only using an unbiased methodology and our articles are not intended to be financial advice. It does not constitute a recommendation to buy or sell any stock, and does not take account of your objectives, or your financial situation. We aim to bring you long-term focused analysis driven by fundamental data. Note that our analysis may not factor in the latest price-sensitive company announcements or qualitative material. Simply Wall St has no position in any stocks mentioned.