Assessing Hilltop Holdings (HTH) Valuation After Recent Share Price Momentum And Premium P/E Ratio
Hilltop Holdings Inc. HTH | 35.93 | -0.17% |
What Hilltop Holdings (HTH) investors are reacting to
Hilltop Holdings (HTH) has drawn fresh attention after recent share price moves, with the stock showing a 0.8% decline over the past day alongside gains over the past week and month.
While the 0.8% one day share price decline to US$35.39 caught attention, the 90 day share price return of 8.6% alongside a 1 year total shareholder return of 25.1% points to momentum that has been building rather than fading.
If bank stocks like Hilltop Holdings are on your radar, this could be a good moment to broaden your research with fast growing stocks with high insider ownership and see what else stands out.
With Hilltop trading close to its analyst price target and carrying a strong recent return, the key question now is whether the current valuation still leaves upside on the table or if the market is already pricing in future growth.
Price-to-earnings of 13.6x: Is it justified?
Hilltop Holdings last closed at US$35.39, and its current P/E of 13.6x suggests investors are paying a premium to the wider US banks industry but slightly less than the peer average.
The P/E ratio tells you how much investors are paying today for each dollar of current earnings, which is especially watched for banks where earnings and return on equity are key reference points. For Hilltop, the 13.6x multiple sits below the broader US market P/E of 19.4x, yet above the US banks industry average of 11.9x. This raises the question of whether its earnings profile justifies that extra stretch versus sector peers.
Compared to the estimated fair P/E of 8.8x, Hilltop's current 13.6x looks materially richer, suggesting the market valuation is significantly above the level that fair value model points to and could move toward over time. Against the banks industry average of 11.9x, the current P/E also screens as more expensive, even though it remains slightly cheaper than the 14x peer group average that Hilltop is benchmarked against.
Result: Price-to-earnings of 13.6x (OVERVALUED)
However, you also need to weigh risks like annual net income contraction of 9.3% and a P/E premium to the US banks industry, which could compress if sentiment cools.
Another view using our DCF model
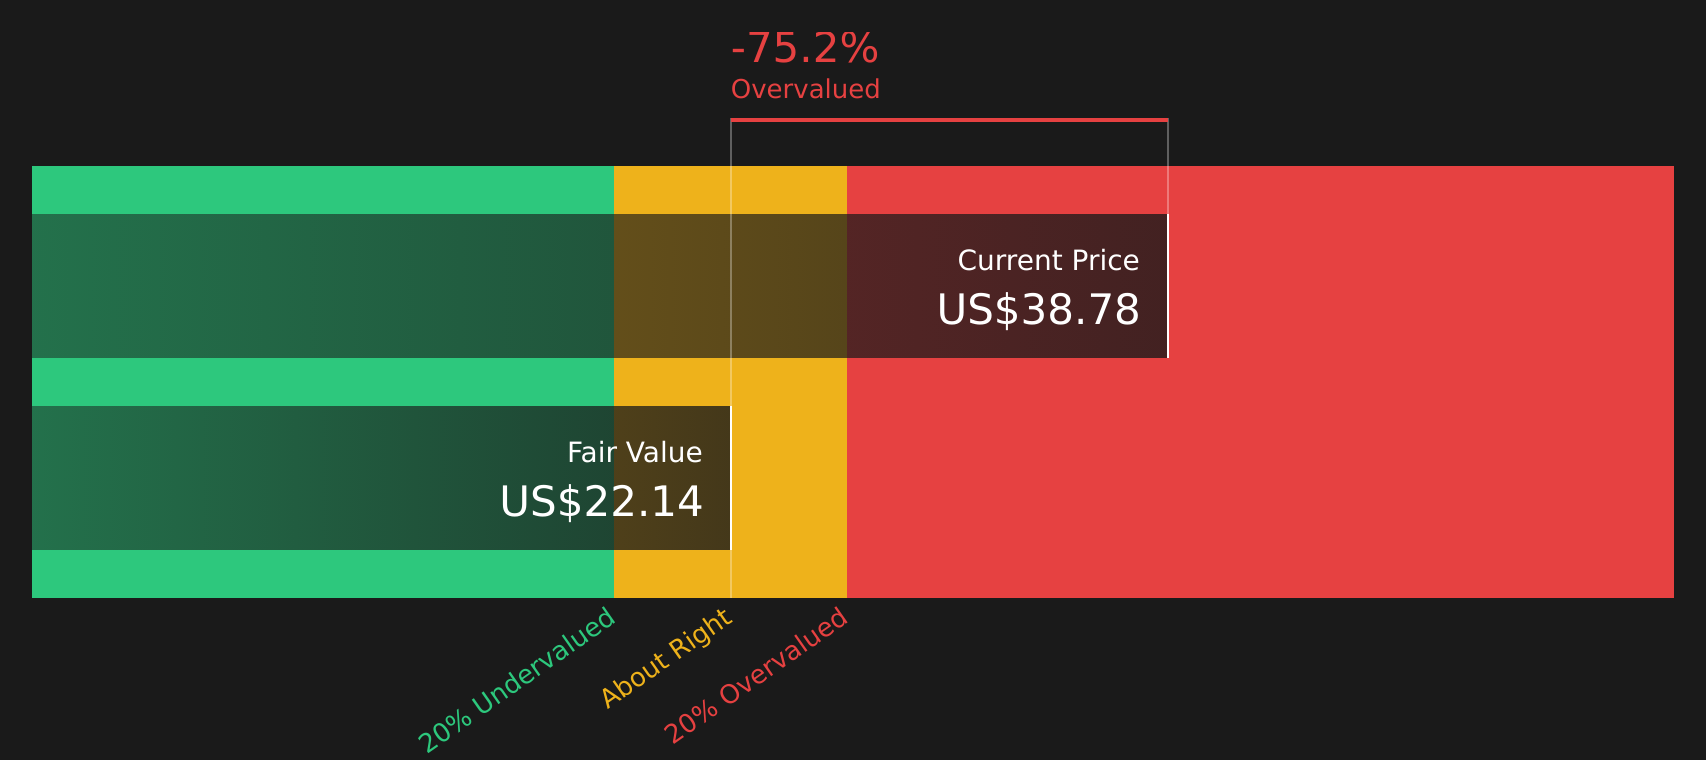
Our DCF model arrives at an estimated fair value of US$23.16 per share for Hilltop Holdings, compared with the current price of US$35.39. That indicates that shares are trading above this fair value estimate and raises the question of whether recent strength leaves more room for further gains, or less.
Simply Wall St performs a discounted cash flow (DCF) on every stock in the world every day (check out Hilltop Holdings for example). We show the entire calculation in full. You can track the result in your watchlist or portfolio and be alerted when this changes, or use our stock screener to discover 876 undervalued stocks based on their cash flows. If you save a screener we even alert you when new companies match - so you never miss a potential opportunity.
Build Your Own Hilltop Holdings Narrative
If you look at this and feel differently, or you prefer to work directly with the numbers, you can quickly build and stress test your own view with Do it your way.
A great starting point for your Hilltop Holdings research is our analysis highlighting 2 key rewards and 1 important warning sign that could impact your investment decision.
Looking for more investment ideas?
If you stop at Hilltop, you could miss other opportunities that fit your style. Use the screener tools to widen your options while staying focused.
- Spot companies the market might be overlooking by checking these 876 undervalued stocks based on cash flows filtered using discounted cash flow based signals and fundamentals.
- Target income focused ideas by scanning these 13 dividend stocks with yields > 3% that concentrate on yields above 3% with supporting metrics.
- Get ahead of emerging themes by reviewing these 19 cryptocurrency and blockchain stocks tied to digital assets, blockchain infrastructure, and related services.
This article by Simply Wall St is general in nature. We provide commentary based on historical data and analyst forecasts only using an unbiased methodology and our articles are not intended to be financial advice. It does not constitute a recommendation to buy or sell any stock, and does not take account of your objectives, or your financial situation. We aim to bring you long-term focused analysis driven by fundamental data. Note that our analysis may not factor in the latest price-sensitive company announcements or qualitative material. Simply Wall St has no position in any stocks mentioned.