Assessing JD.com’s Value After a 14% Drop and Renewed E-Commerce Competition
JD.com, Inc. Sponsored ADR Class A JD | 28.45 | -1.45% |
- Wondering whether JD.com is finally a bargain after its recent slump? Let’s take a closer look at what the numbers and market sentiment are really saying.
- The stock has seen some big swings lately, losing 7.8% over the past week and tumbling 14.4% year-to-date. This has kept investors questioning the direction and risk of JD.com’s share price.
- Reports of renewed competition in China’s e-commerce sector, along with ongoing regulatory concerns, have added volatility. Recent headlines about shifting consumer spending habits and tech sector reforms are especially shaping investor sentiment right now.
- If you’re focused on value, JD.com currently scores 5 out of 6 on our undervaluation checks, which is impressive. However, the real story comes down to how we approach valuation itself, and we’ll explore a powerful new method by the end of this article.
Approach 1: JD.com Discounted Cash Flow (DCF) Analysis
The Discounted Cash Flow (DCF) model estimates a company's value by projecting its future cash flows and then discounting those amounts back to today's value. For JD.com, this method helps to cut through short-term market noise and focus on the fundamentals underpinning its share price.
JD.com’s latest reported Free Cash Flow stands at a loss of about CN¥233 million. Analysts expect strong improvement over the next decade. By 2028, forecasts point to Free Cash Flow reaching roughly CN¥49.9 billion. Although only five years of analyst estimates are available, future values are extrapolated to provide a fuller picture.
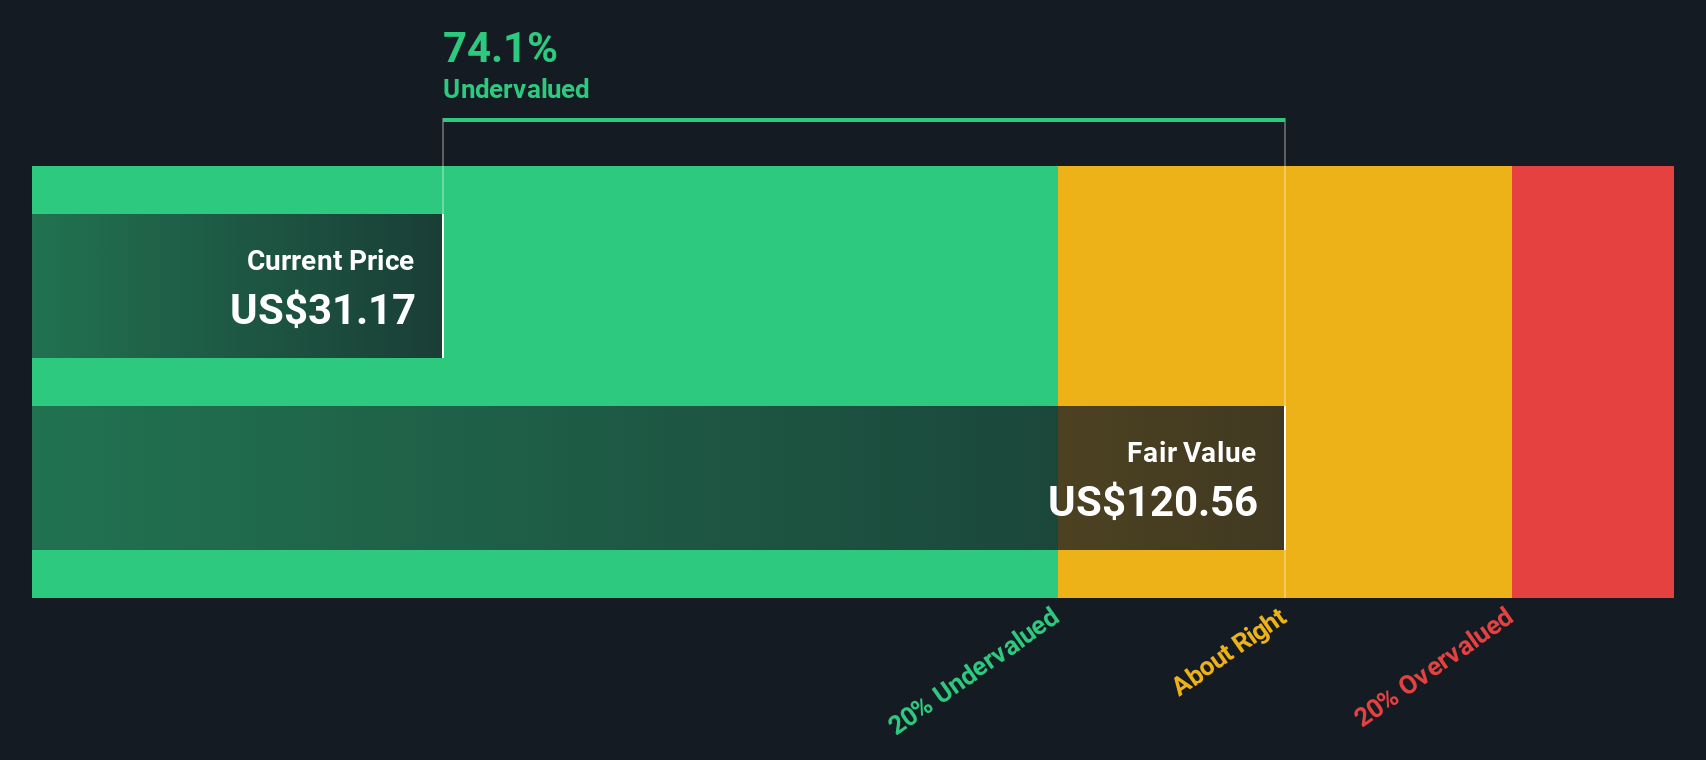
Based on these projections, the DCF model estimates JD.com’s fair value at $60.86 per share compared to the current market price. This calculation suggests the stock is trading at a 51.8% discount to its intrinsic value, making it appear significantly undervalued by this measure.
Result: UNDERVALUED
Our Discounted Cash Flow (DCF) analysis suggests JD.com is undervalued by 51.8%. Track this in your watchlist or portfolio, or discover 885 more undervalued stocks based on cash flows.
Approach 2: JD.com Price vs Earnings
The price-to-earnings (PE) ratio is widely considered the go-to valuation multiple for profitable companies like JD.com because it links a company’s share price directly to its current earnings, providing a straightforward gauge of value for investors. A “normal” or “fair” PE ratio for a stock depends on expected growth rates and risks, so higher growth or lower risk can justify a higher ratio, while slower growth or more risk tends to drag it lower.
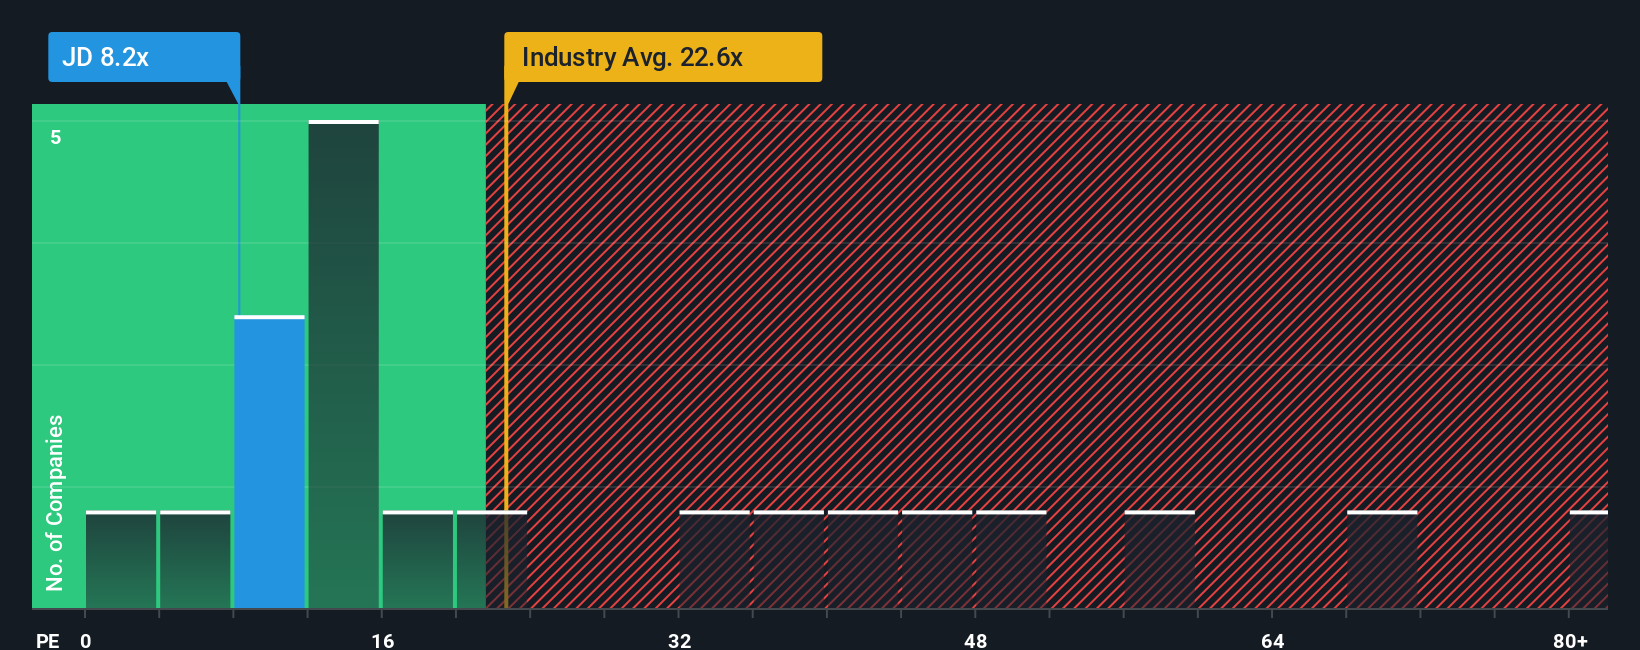
JD.com currently trades at a PE ratio of 9.17x, which stands out as considerably lower than the Multiline Retail industry average of 20.32x and the peer average of 64.65x. This initial comparison suggests that JD.com may be valued more conservatively by the market. However, there is an important nuance. Simple benchmarks like these do not fully reflect JD.com’s unique growth profile, risk factors, profit margins, or its size and market position.
This is where Simply Wall St’s proprietary “Fair Ratio” comes in. Unlike basic comparisons, the Fair Ratio for JD.com is calculated at 23.47x, reflecting expectations for its growth, profitability, risk, and how it measures up within its industry and market capitalization. Because the Fair Ratio tailors the benchmark to JD.com’s specific circumstances, it provides a more realistic and actionable sense of what constitutes fair value.
Comparing JD.com’s actual PE of 9.17x to the Fair Ratio of 23.47x, the stock appears attractively undervalued on this metric, potentially offering a margin of safety for value-focused investors.
Result: UNDERVALUED
PE ratios tell one story, but what if the real opportunity lies elsewhere? Discover 1411 companies where insiders are betting big on explosive growth.
Upgrade Your Decision Making: Choose your JD.com Narrative
Earlier we mentioned that there is an even better way to understand valuation, so let’s introduce you to Narratives. A Narrative is your unique investment story for a company. It is the perspective or thesis you bring, combining your expectations of JD.com’s future revenue, earnings, and margins, all tied to your own assumed fair value estimate. Think of Narratives as a bridge that connects your view of JD.com’s business strategy and prospects to a set of financial forecasts, and then directly to a fair value for the stock.
With Narratives, which are available right within the Simply Wall St Community page, millions of investors can easily create and share their own valuation stories. They can instantly see how their fair value compares with the latest share price. What makes Narratives especially powerful is that they update automatically as new information, like earnings releases or major news, emerges. This means your investment case for JD.com can dynamically reflect the latest data, risks, and opportunities.
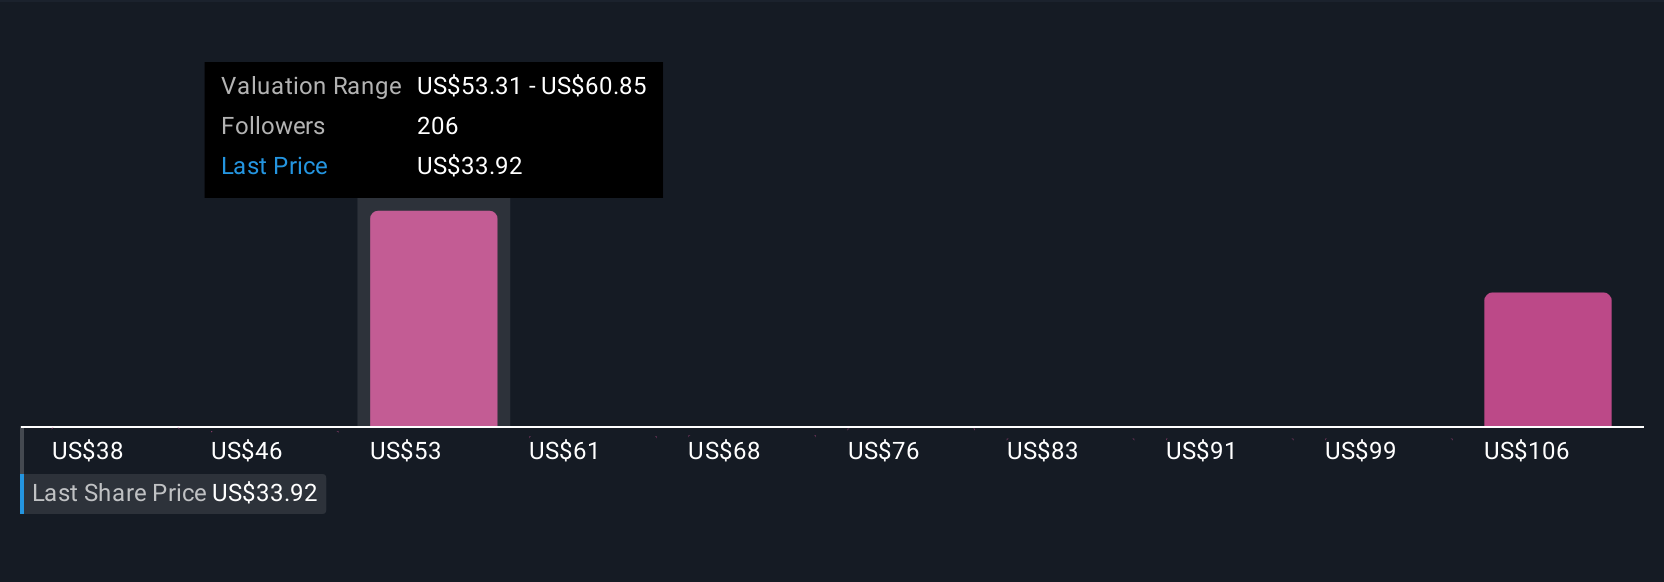
For example, you might believe JD.com’s logistics investments will drive rapid earnings growth and assign a fair value near $60. Another investor, worried about competition and margin pressure, may argue for a much lower fair value closer to $28. Narratives let you clearly see and compare these different viewpoints, helping you decide whether now is the right time to buy, hold, or sell.
Do you think there's more to the story for JD.com? Head over to our Community to see what others are saying!
This article by Simply Wall St is general in nature. We provide commentary based on historical data and analyst forecasts only using an unbiased methodology and our articles are not intended to be financial advice. It does not constitute a recommendation to buy or sell any stock, and does not take account of your objectives, or your financial situation. We aim to bring you long-term focused analysis driven by fundamental data. Note that our analysis may not factor in the latest price-sensitive company announcements or qualitative material. Simply Wall St has no position in any stocks mentioned.