Assessing Legence (LGN) Valuation After A Sharp Multi‑Month Share Price Rally
Legence Corp. Class A LGN | 0.00 |
Legence (LGN) has drawn fresh attention after a strong recent share performance, with the stock up about 56% over the past month and roughly 84% in the past 3 months.
At a share price of $91.41, Legence has seen strong short term momentum, with a 7 day share price return of 12.26% and a year to date share price return of 104.59%. This suggests sentiment has shifted quickly in recent weeks as investors reassess the company’s prospects and risks.
If rapid moves in one stock have you looking around the market, this is a good time to widen your search using our screener focused on 36 power grid technology and infrastructure stocks
With Legence trading at $91.41 against an average analyst target of $75.42 and only a modest intrinsic discount implied, you have to ask: is the stock now stretched, or is the market correctly pricing in future growth?
Preferred Price-to-Sales of 2.8x: Is it justified?
Legence currently trades on a P/S of 2.8x, which sits between the estimated fair P/S of 4x and the broader US Construction industry average of 1.8x.
The P/S ratio compares the company’s market value to its annual revenue, so at 2.8x investors are valuing each $1 of Legence’s revenue at $2.80. For a business focused on engineering, installation and maintenance services across mission critical building systems, this can reflect how the market weighs its growth profile against current losses.
On one hand, the SWS fair P/S ratio of 4x suggests the current 2.8x level is below the relationship typically seen between similar companies and their fundamentals, which some investors may view as a level the market could move towards if expectations hold. On the other hand, compared with the US Construction industry average of 1.8x, Legence trades at a clear premium, indicating investors are already paying more per dollar of revenue than for many peers.
Result: Price-to-Sales of 2.8x (ABOUT RIGHT)
However, you still need to weigh risks, including Legence’s current net loss of $33.80m and its premium P/S multiple compared with the broader US Construction peer group.
Another View: What the SWS DCF Model Says
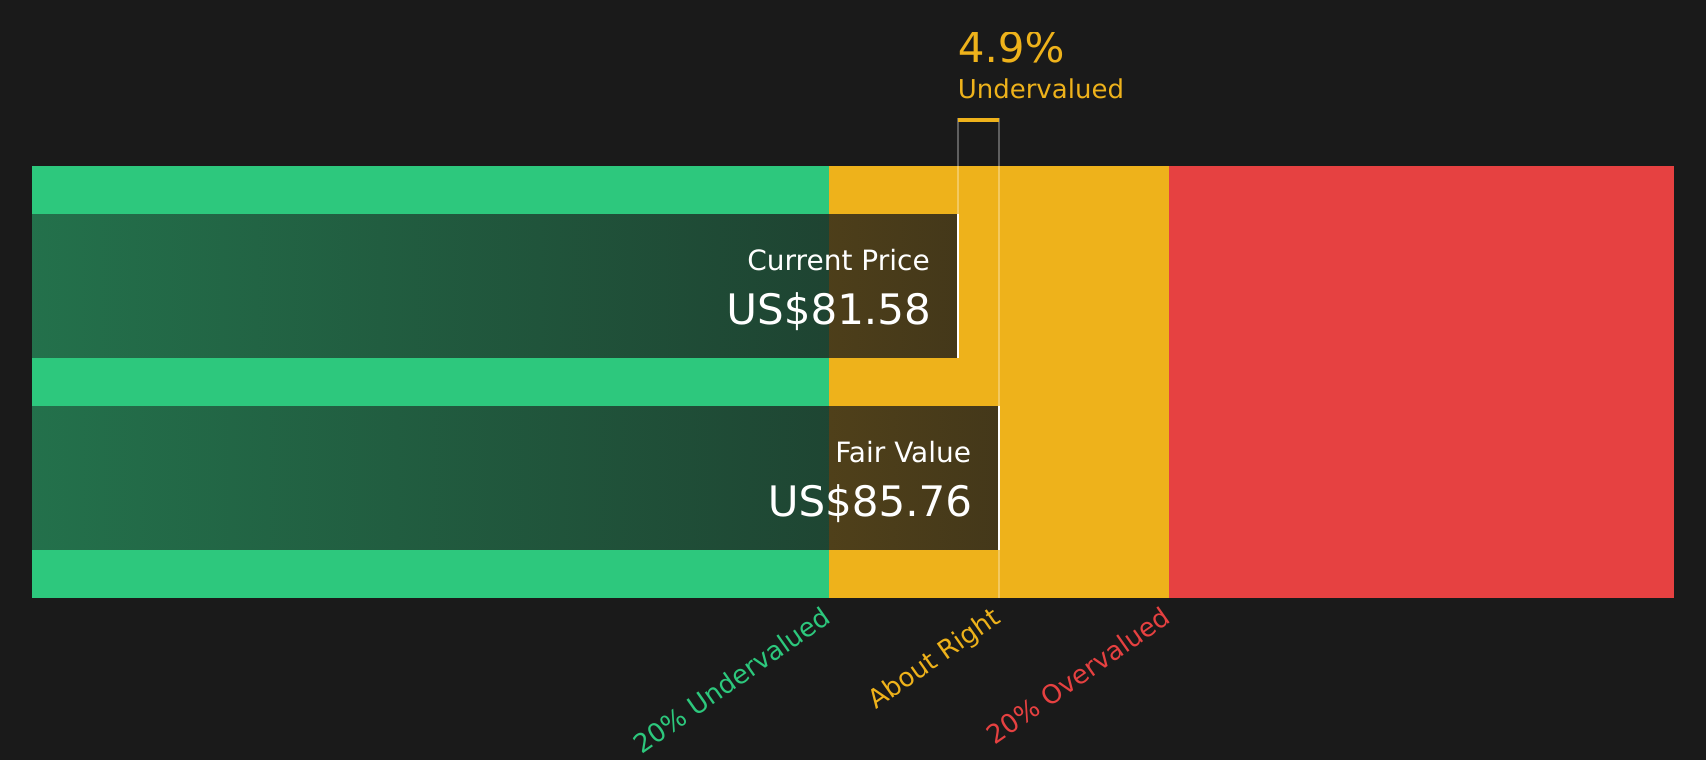
While the P/S of 2.8x looks roughly in line with the fair ratio, the SWS DCF model points in a similar direction. At a share price of $91.41, Legence is trading about 4.7% below an estimated future cash flow value of $95.97, which suggests only a small margin either way for valuation risk or opportunity.
Simply Wall St performs a discounted cash flow (DCF) on every stock in the world every day (check out Legence for example). We show the entire calculation in full. You can track the result in your watchlist or portfolio and be alerted when this changes, or use our stock screener to discover 48 high quality undervalued stocks. If you save a screener we even alert you when new companies match - so you never miss a potential opportunity.
Next Steps
With sentiment around Legence looking upbeat, this is a moment to move quickly and check the underlying drivers for yourself. To see what investors are optimistic about in the company profile, review the 3 key rewards
Looking for more investment ideas?
If Legence has caught your eye, do not stop there. Use this momentum to quickly scan other opportunities that might suit your goals just as well.
- Spot potential bargains early by checking out screener containing 25 high quality undiscovered gems before others start paying attention.
- Strengthen your core holdings by reviewing the solid balance sheet and fundamentals stocks screener (44 results) and focusing on companies with resilient finances.
- Build a steadier income stream by assessing the 12 dividend fortresses while yields remain compelling.
This article by Simply Wall St is general in nature. We provide commentary based on historical data and analyst forecasts only using an unbiased methodology and our articles are not intended to be financial advice. It does not constitute a recommendation to buy or sell any stock, and does not take account of your objectives, or your financial situation. We aim to bring you long-term focused analysis driven by fundamental data. Note that our analysis may not factor in the latest price-sensitive company announcements or qualitative material. Simply Wall St has no position in any stocks mentioned.