Assessing Lucid Group (LCID) Valuation After Its Record 2026 NAF Winter Test Range Performance
Lucid LCID | 9.96 | +4.18% |
Lucid Group (LCID) is back in focus after its Lucid Air Grand Touring covered 520 kilometers without recharging in the 2026 NAF Winter Test, in extreme cold conditions.
That winter range result lands after a choppy period for the stock, with the latest share price at $11.33 and a 30 day share price return of 3.94% against a 90 day decline of 36.17%. Over a longer horizon, total shareholder return shows a 1 year loss of 58.35% and a 3 year loss of 90.61%, so recent momentum is improving slightly but sits against a steep multi year drawdown.
If Lucid’s progress on range and manufacturing has caught your attention, it could be a good prompt to scan other auto names and compare business models across auto manufacturers.
With Lucid shares down sharply over 1 and 3 years but trading at $11.33 and a reported discount to some analyst targets, you have to ask: is this punished EV name undervalued now, or already priced for its future growth?
Most Popular Narrative: 38.5% Undervalued
Lucid Group’s most followed narrative suggests a fair value of $18.43 per share versus the recent $11.33 price, framing a wide gap to current trading.
The newly announced Uber and Nuro partnership, including a planned $300 million Uber investment and a commitment to deploy at least 20,000 Lucid Gravity vehicles as robotaxis over six years, is expected to open a large and fast-growing autonomous fleet market to Lucid, driving significant revenue expansion and potential margin improvement via technology licensing and high-volume fleet sales.
Curious what kind of revenue curve and future profit margin need to line up for that $18.43 fair value? The popular narrative leans on rapid top line expansion, margin repair from deep losses, and a premium P/E multiple that assumes Lucid looks very different a few years from now. The full story connects those moving parts into one pricing argument.
Result: Fair Value of $18.43 (UNDERVALUED)
However, this upbeat story still hinges on Lucid reversing heavy losses of about US$3.1b and managing ongoing funding needs without significantly diluting existing shareholders.
Another View: Multiples Paint A Tougher Picture
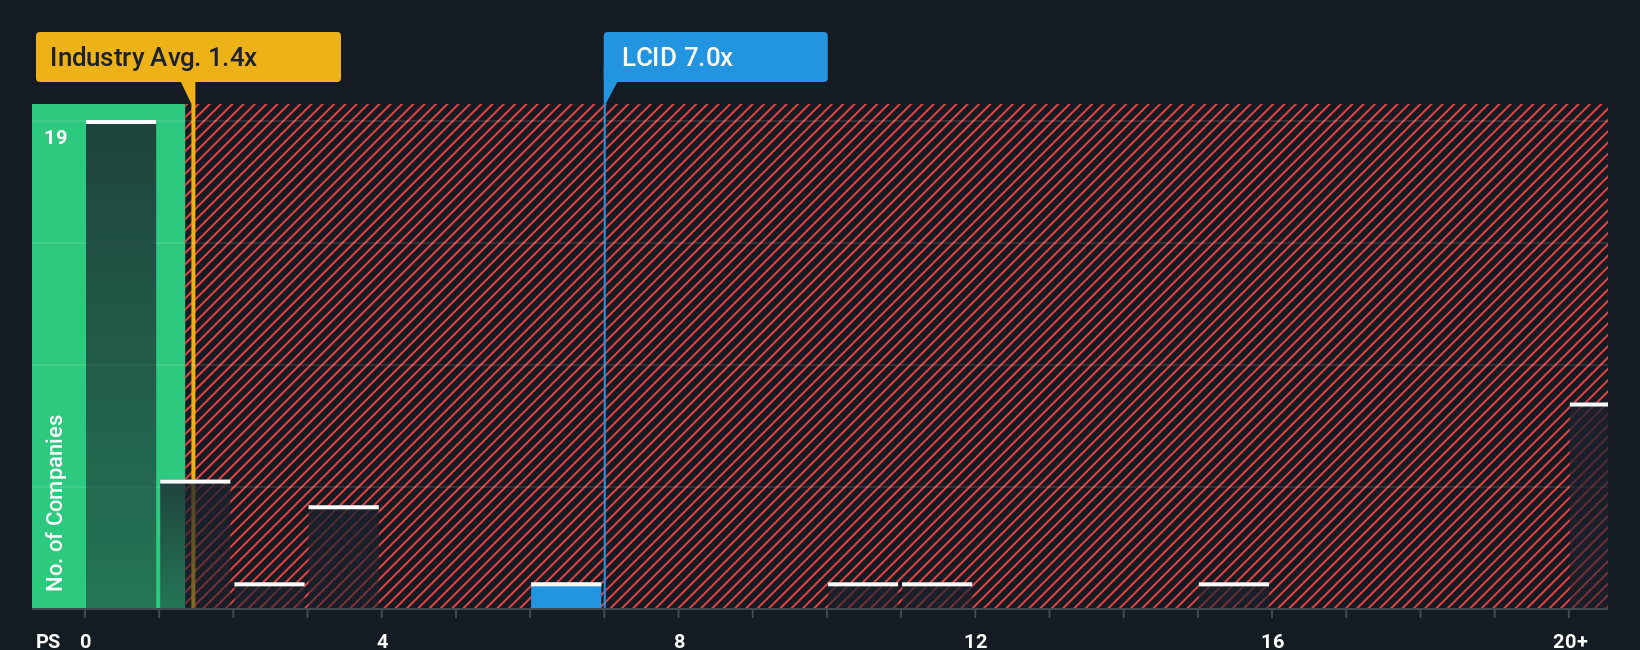
That 38.5% “undervalued” fair value hinges on long term earnings assumptions, but today’s price tells a different story. Lucid trades on a P/S of 3.4x, compared with 0.7x for the US Auto industry and 1.3x for peers, while the fair ratio model points to a P/S of 0x.
Those gaps suggest the market is already paying a rich revenue multiple despite heavy losses and a short cash runway. If the share price were to move closer to the fair ratio over time, current holders could be exposed to valuation compression rather than upside. Which version of Lucid’s story do you trust most: the future earnings narrative or the present day sales multiple?
Build Your Own Lucid Group Narrative
If you see Lucid’s story differently or prefer to test the numbers yourself, you can build a custom narrative in a few minutes with Do it your way.
A great starting point for your Lucid Group research is our analysis highlighting 1 key reward and 2 important warning signs that could impact your investment decision.
Looking for more investment ideas?
If Lucid has sparked your interest, do not stop here, the best opportunities often show up where you are not already looking, so broaden your watchlist now.
- Spot potential mispricing by reviewing these 866 undervalued stocks based on cash flows which might offer more compelling entry points than headline names.
- Tap into the AI trend early by scanning these 23 AI penny stocks that tie real revenue to artificial intelligence, not just buzzwords.
- Boost your income focus by checking out these 14 dividend stocks with yields > 3% that aim to combine yield with underlying business strength.
This article by Simply Wall St is general in nature. We provide commentary based on historical data and analyst forecasts only using an unbiased methodology and our articles are not intended to be financial advice. It does not constitute a recommendation to buy or sell any stock, and does not take account of your objectives, or your financial situation. We aim to bring you long-term focused analysis driven by fundamental data. Note that our analysis may not factor in the latest price-sensitive company announcements or qualitative material. Simply Wall St has no position in any stocks mentioned.