

Assessing Manchester United (MANU) Valuation As Shares Show Strong Recent Momentum
Manchester United Plc Class A MANU | 0.00 |
Recent share performance and business snapshot
Manchester United (MANU) stock has drawn fresh attention after recent trading, with the price closing at US$21.01 and showing positive returns over the past week, month and past 3 months.
Over the past year, the stock has delivered a total return of 48.27%, with a year to date total return of 33.14%. Longer term, total returns are 11.64% over three years and 36.83% over five years.
The company operates a professional football club and related commercial activities, including sponsorships, media rights, branded retail and e-commerce, and management of the Old Trafford stadium. Reported revenue stands at £684.33 million.
Despite this revenue base, Manchester United reported a net income loss of £18.13 million, while revenue and net income growth rates on an annual basis are 7.97% and 107.97% respectively. The current market capitalization is about US$3.46b.
For investors assessing valuation, the stock carries a value score of 2 and an indicated intrinsic discount of 39.25%. The discount to the referenced analyst target level is 23.42%, which some investors may see as a potential margin between current trading and external expectations.
The recent 20.06% 1 month share price return and 16.66% 3 month share price return suggest building momentum, while the 48.27% 1 year total shareholder return places the current US$21.01 share price and valuation metrics in a broader uptrend context.
If you are comparing Manchester United's momentum with other themes in the market, this could be a useful moment to look beyond football and check out 20 top founder-led companies
With the stock trading at US$21.01, alongside an indicated 39.25% intrinsic discount and a 23.42% gap to analyst targets, you have to ask: is this a genuine value opportunity, or is the market already pricing in future growth?
Preferred Price-to-Sales of 3.9x: Is it justified?
On a P/S basis, Manchester United looks expensive at a 3.9x multiple, especially when compared with both its peer group and the wider US Entertainment industry.
The P/S ratio compares the company’s market value to its revenue and is often used when earnings are weak or loss making. For a club like Manchester United, where brand, media rights and sponsorships are key, this measure helps you see how much investors are paying for each dollar of current sales.
Right now, investors are paying a higher P/S than both the peer average and the broader entertainment space. This suggests a premium is being placed on future cash flows and brand strength rather than current profitability. The company is currently unprofitable and has a negative return on equity. Yet the stock trades at 3.9x sales, above the peer average of 2.6x and well above the US Entertainment industry average of 1.2x. Some investors might expect the market to move closer to these levels if sentiment changes.
Result: Price-to-sales of 3.9x (OVERVALUED)
However, the current loss of £18.13 million and a P/S premium to peers mean that any shift in sentiment or weaker commercial demand could quickly pressure this valuation.
Another view on value: DCF vs sales multiple
While the 3.9x P/S ratio suggests the stock looks expensive against peers, the SWS DCF model points in the opposite direction. At a share price of $21.01, the stock is trading 39.2% below an estimated fair value of $34.58, which indicates potential upside if those cash flow assumptions hold.
That contrast raises a key question: is the market correctly pricing near term risks around profitability and balance sheet strength, or is it being too cautious about a business that analysts expect to move back into profit over the next three years?
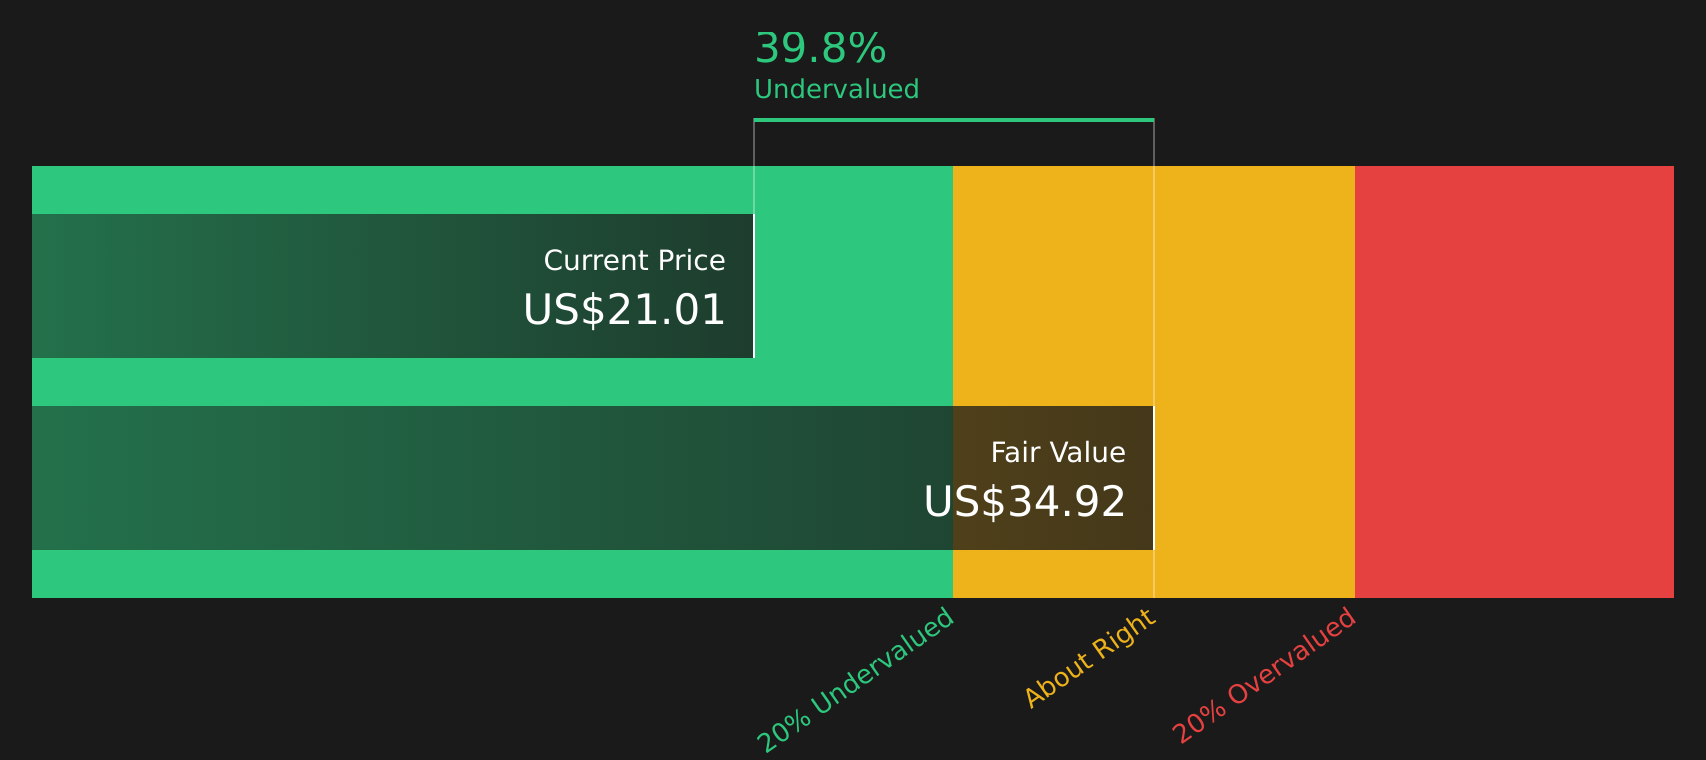
Simply Wall St performs a discounted cash flow (DCF) on every stock in the world every day (check out Manchester United for example). We show the entire calculation in full. You can track the result in your watchlist or portfolio and be alerted when this changes, or use our stock screener to discover 46 high quality undervalued stocks. If you save a screener we even alert you when new companies match - so you never miss a potential opportunity.
Next Steps
With sentiment split between potential upside and clear risks, it can be useful to move quickly, review the numbers yourself and weigh both sides. To see the full picture of what the market is optimistic and cautious about, start with the 3 key rewards and 1 important warning sign
Looking for more investment ideas?
If you stop at Manchester United, you could miss other opportunities that fit your style, so take a few minutes to scan what else the market offers.
- Target quality at a discount by checking companies that look mispriced on fundamentals with the help of 46 high quality undervalued stocks.
- Prioritize stability and sleep better at night by reviewing companies with stronger financial footing using the solid balance sheet and fundamentals stocks screener (46 results).
- Get ahead of the crowd by focusing on underfollowed opportunities through the screener containing 22 high quality undiscovered gems.
This article by Simply Wall St is general in nature. We provide commentary based on historical data and analyst forecasts only using an unbiased methodology and our articles are not intended to be financial advice. It does not constitute a recommendation to buy or sell any stock, and does not take account of your objectives, or your financial situation. We aim to bring you long-term focused analysis driven by fundamental data. Note that our analysis may not factor in the latest price-sensitive company announcements or qualitative material. Simply Wall St has no position in any stocks mentioned.