Assessing Marvell Technology (MRVL) After A 35% One-Year Share Price Slide
Marvell Technology, Inc. MRVL | 107.11 | +0.37% |
- If you are wondering whether Marvell Technology is attractively priced or just feels cheap after a tough run, this article is designed to walk you through the key valuation angles in a clear, practical way.
- Marvell's share price closed at US$80.46, with returns of a 3.3% decline over 7 days, a 1.5% decline over 30 days, a 10.0% decline year to date, a 35.3% decline over 1 year, but a 106.1% gain over 3 years and a 56.0% gain over 5 years. This gives a mixed picture for anyone thinking about entry or exit points.
- Recent coverage around Marvell has focused on its role in key semiconductor markets, its positioning in cloud and data infrastructure, and how investors are weighing that against sector wide volatility. Together, these themes help explain why the stock has experienced both sharp setbacks and strong multi year returns.
- On our checks, Marvell scores 5 out of 6 for potential undervaluation. We will look at what different valuation methods say about that score, then finish by showing you a way to tie those numbers back to your own view of value.
Approach 1: Marvell Technology Discounted Cash Flow (DCF) Analysis
A DCF model projects a company’s future cash flows, then discounts those projections back to today’s dollars to estimate what the business might be worth right now.
For Marvell Technology, the model used is a 2 Stage Free Cash Flow to Equity approach, based on cash flows in US$. The latest twelve month free cash flow is about $1.50b. Analyst estimates run through 2030, with projected free cash flow in that year of $5.59b, and Simply Wall St then extrapolates out to 2035, keeping the projections consistent with the earlier growth assumptions.
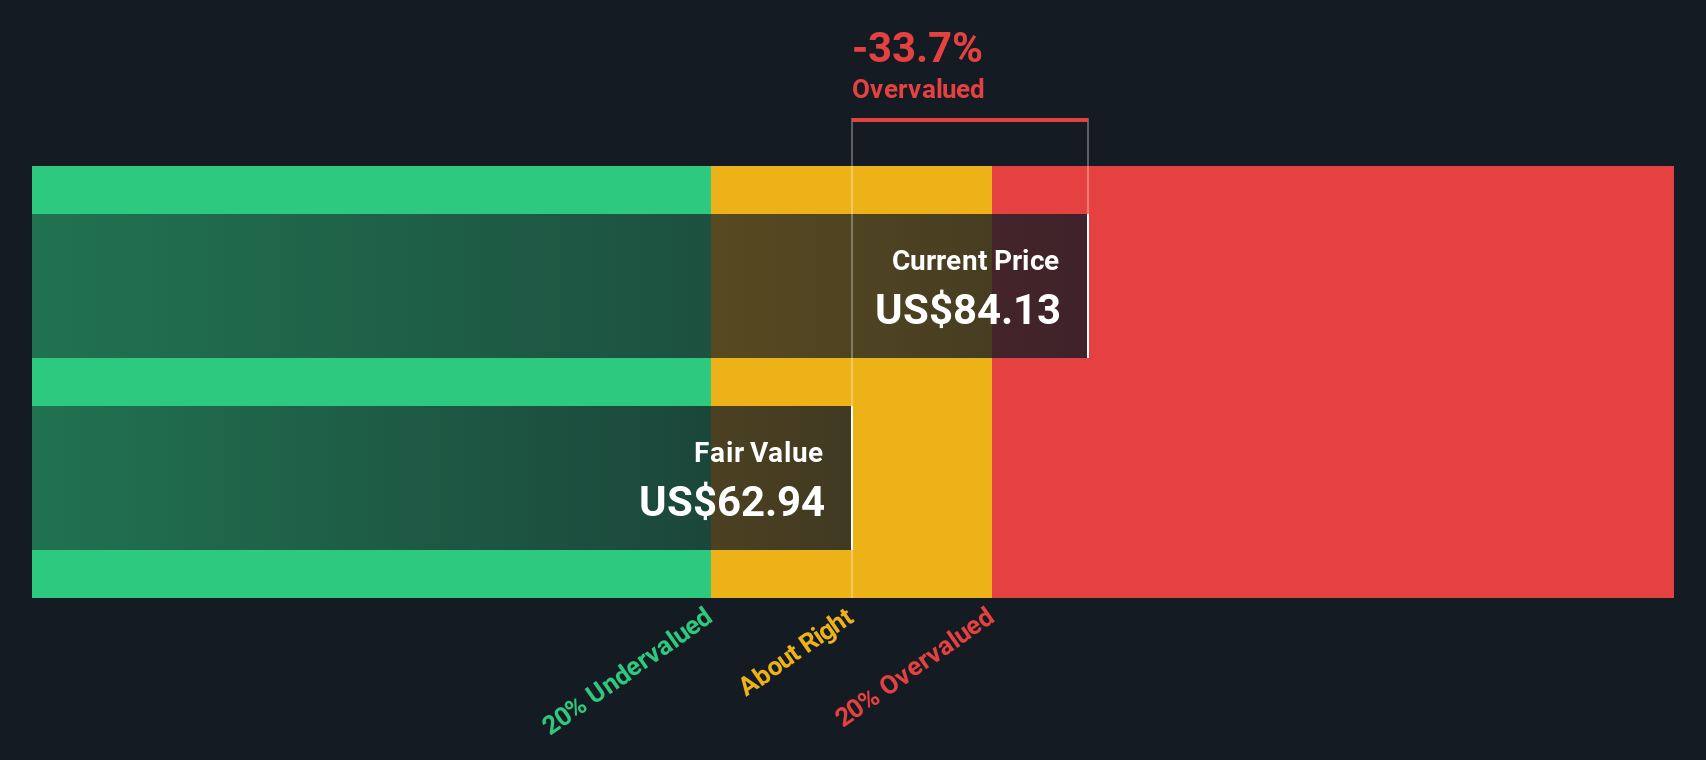
These future cash flows, ranging from about $1.81b in 2026 up to an estimated $9.49b in 2035, are discounted back to today using the model’s required return. This produces an estimated intrinsic value of US$90.34 per share.
Compared to the recent share price of US$80.46, this implies the stock trades at roughly a 10.9% discount to the DCF estimate. On this specific cash flow view, Marvell appears to be trading below the model’s estimated intrinsic value.
Result: UNDERVALUED
Our Discounted Cash Flow (DCF) analysis suggests Marvell Technology is undervalued by 10.9%. Track this in your watchlist or portfolio, or discover 863 more undervalued stocks based on cash flows.
Approach 2: Marvell Technology Price vs Earnings
For a profitable company like Marvell, the P/E ratio is a practical way to think about what you are paying for each dollar of earnings. It helps you compare the share price to the underlying profit, which is often how the market frames valuations for established, earnings generating businesses.
What counts as a “fair” P/E usually reflects how the market sees a company’s growth prospects and risk. Higher expected growth or lower perceived risk can support a higher P/E, while lower growth or higher risk can point to a lower one.
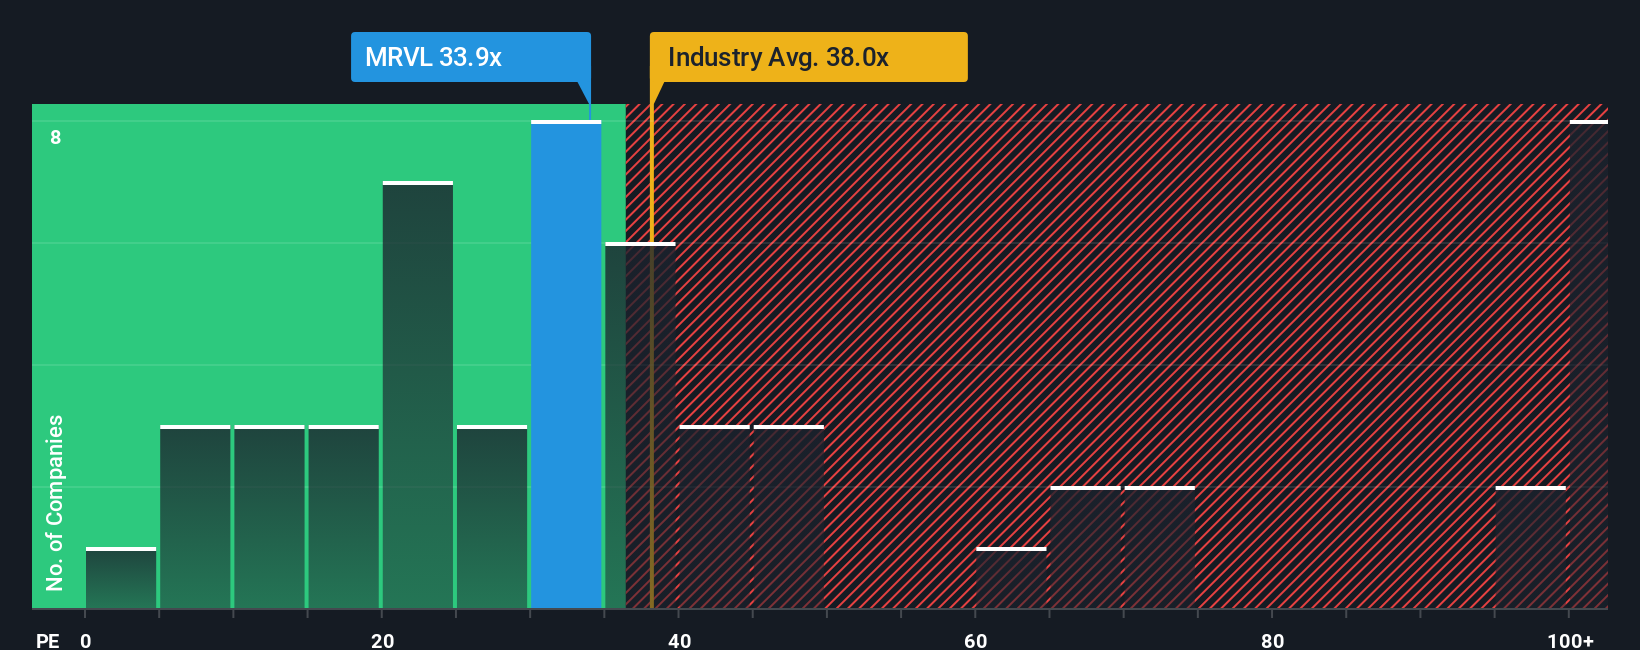
Marvell currently trades on a P/E of 27.58x. That sits below the Semiconductor industry average of 43.37x and below the peer group average of 63.78x. Simply Wall St also calculates a proprietary “Fair Ratio” for Marvell of 37.84x, which is the P/E level implied by factors such as its earnings growth profile, industry, profit margin, market cap and risk characteristics.
This Fair Ratio is more tailored than a simple comparison with peers or the broader industry, because it folds in company specific traits rather than assuming one size fits all. Set against Marvell’s current 27.58x P/E, the 37.84x Fair Ratio suggests the shares are trading below that model based reference point.
Result: UNDERVALUED
P/E ratios tell one story, but what if the real opportunity lies elsewhere? Discover 1445 companies where insiders are betting big on explosive growth.
Upgrade Your Decision Making: Choose your Marvell Technology Narrative
Earlier we mentioned that there is an even better way to understand valuation, so let us introduce you to Narratives, which are simply your own story about Marvell that links what you think will happen to its revenue, earnings and margins, into a financial forecast and then into a fair value that you can compare with the current price.
On Simply Wall St’s Community page, you can pick or create a Narrative that reflects your view. For example, one investor might lean toward the higher analyst fair value of about US$122 if they think AI infrastructure growth, custom silicon wins and margin expansion will track the more bullish earnings estimates. Another might align closer to the US$58.2 end of the range if they focus on risks around data center concentration, project lumpiness and supply chain constraints. Once you have that Narrative in place, the platform keeps it updated when new earnings, news or forecasts arrive, so you can quickly see when your fair value is above or below the current share price and decide if that supports a buy, hold or sell decision for you.
Do you think there's more to the story for Marvell Technology? Head over to our Community to see what others are saying!

This article by Simply Wall St is general in nature. We provide commentary based on historical data and analyst forecasts only using an unbiased methodology and our articles are not intended to be financial advice. It does not constitute a recommendation to buy or sell any stock, and does not take account of your objectives, or your financial situation. We aim to bring you long-term focused analysis driven by fundamental data. Note that our analysis may not factor in the latest price-sensitive company announcements or qualitative material. Simply Wall St has no position in any stocks mentioned.