Assessing Moody’s (MCO) Valuation After Recent Share Price Weakness And Private Credit Growth Narrative
Moody's Corporation MCO | 438.06 438.06 | -0.35% 0.00% Pre |
With no single headline event driving attention, Moody's (MCO) is drawing investor interest as its shares remain below recent highs after a one-month decline of 14% and a 6% decline over the past three months.
The 14.1% 1 month share price decline, alongside an 11.2% 7 day pullback to around $457.70, contrasts with Moody's 52.9% 3 year and 71.3% 5 year total shareholder returns. This hints that short term momentum is fading against a stronger long term record.
If this recent weakness has you scanning beyond credit and risk analytics, it could be a good moment to see what stands out in our 22 top founder-led companies as potential new ideas.
With Moody's trading around $457.70, a recent 1 year total return of around an 8% decline, and an intrinsic value estimate that sits at a premium, the key question is whether recent weakness offers a window or if the market already prices in future growth.
Most Popular Narrative: 20.5% Undervalued
Moody's last closed at $457.70, while the most followed narrative anchors fair value at about $575.53, using a detailed cash flow and earnings roadmap built on explicit growth and margin assumptions.
Moody's is experiencing accelerating demand from the rapid evolution and expansion of private credit markets, evidenced by 75% year-over-year growth in private credit revenues, 25% of first-time mandates coming from private credit, and ongoing issuer/investor demand for independent risk assessment. This is cited as strongly supporting future revenue growth and earnings resilience as private credit's share in global financing expands.
Curious what earnings, margin profile, and future P/E the narrative leans on to justify that premium fair value? The full story ties private credit, GenAI enabled analytics, and recurring revenue assumptions into one tight valuation framework.
Result: Fair Value of $575.53 (UNDERVALUED)
However, this hinges on private credit staying accessible and lightly constrained. At the same time, regulatory scrutiny, customer churn, and new AI driven competitors could all chip away at those assumptions.
Another View: High P/E Raises a Caution Flag
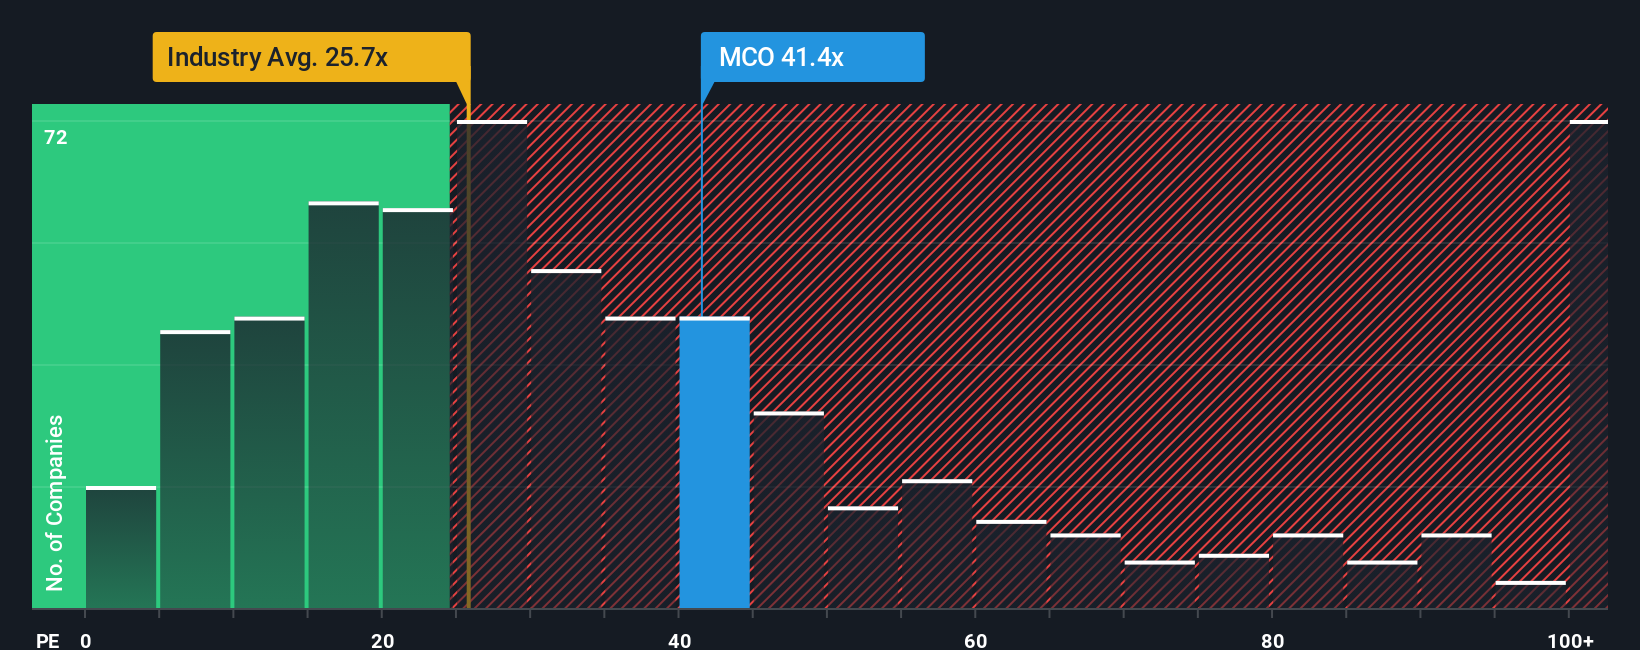
That 20.5% discount to fair value sits alongside a very different signal. Moody's currently trades on a P/E of 36.4x, compared with 22.9x for the US Capital Markets industry, 29.2x for peers, and a fair ratio of 18.5x that our model suggests the market could drift toward.
Put simply, you are paying a much richer price than both the sector and the fair ratio imply. This raises the chance that any disappointment in earnings or private credit growth could hit the share price harder than you might like. Is that premium one you are comfortable carrying through the next few years of execution risk?
Build Your Own Moody's Narrative
If you are not entirely aligned with this view or simply prefer to work from your own numbers, you can pull the data, test your assumptions, and shape a Moody's thesis that fits your outlook in just a few minutes with Do it your way.
A great starting point for your Moody's research is our analysis highlighting 3 key rewards and 1 important warning sign that could impact your investment decision.
Looking for more investment ideas?
If Moody's has sharpened your thinking, do not stop here; broadening your watchlist with fresh, data backed ideas could be the edge you are looking for.
- Spot potential value plays early by scanning our 55 high quality undervalued stocks filtered using fundamentals and pricing signals that may highlight opportunities the broader market has not focused on yet.
- Strengthen your downside protection by reviewing companies in the 81 resilient stocks with low risk scores where lower risk scores and steadier profiles could help balance more aggressive positions.
- Hunt for future leaders hiding in plain sight with the screener containing 25 high quality undiscovered gems and surface lesser known names that still clear solid quality and financial checks.
This article by Simply Wall St is general in nature. We provide commentary based on historical data and analyst forecasts only using an unbiased methodology and our articles are not intended to be financial advice. It does not constitute a recommendation to buy or sell any stock, and does not take account of your objectives, or your financial situation. We aim to bring you long-term focused analysis driven by fundamental data. Note that our analysis may not factor in the latest price-sensitive company announcements or qualitative material. Simply Wall St has no position in any stocks mentioned.