Assessing MPLX (MPLX) Valuation After A 12.5% Distribution Hike And Long Term Growth Pipeline
MPLX LP MPLX | 55.90 | -0.04% |
Why MPLX’s latest distribution move matters
MPLX (MPLX) recently lifted its distribution payment by 12.5%, a move supported by long-term contracts, regulated rate structures, and a multiyear pipeline of organic projects scheduled through 2029.
The higher distribution comes as MPLX’s share price has also been firm, with a 90 day share price return of 9.32% and a 1 year total shareholder return of 15.75%. This suggests momentum has been building over both income and capital returns.
If MPLX’s mix of income and infrastructure appeals to you, this could be a good moment to broaden your watchlist with aerospace and defense stocks as another area of the market to research.
With MPLX trading at US$55.62, modestly below an analyst price target of US$57.23 and showing solid multi year total returns, the key question is whether this income heavyweight is still mispriced or whether markets are already pricing in future growth.
Price-to-Earnings of 11.8x: Is it justified?
At a P/E of 11.8x and a last close of US$55.62, MPLX screens as undervalued compared with both its peers and an estimated fair P/E level.
The P/E ratio links what you pay today to the earnings the business is already generating, which is particularly relevant for a cash generative midstream operator. For MPLX, this means the market is valuing each dollar of current earnings at a discount to what similar oil and gas names trade on.
Against the US Oil and Gas industry average P/E of 13.5x, MPLX sits on a lower multiple, and it also stands below the peer average of 20.6x. The estimated fair P/E of 20.1x is materially higher than the current 11.8x. This gap highlights how far sentiment could shift if pricing were to move closer to that fair ratio level.
Result: Price-to-Earnings of 11.8x (UNDERVALUED)
However, steady distributions still face risks, including energy demand shifts that could affect volumes and the influence of parent Marathon Petroleum on future capital and payout decisions.
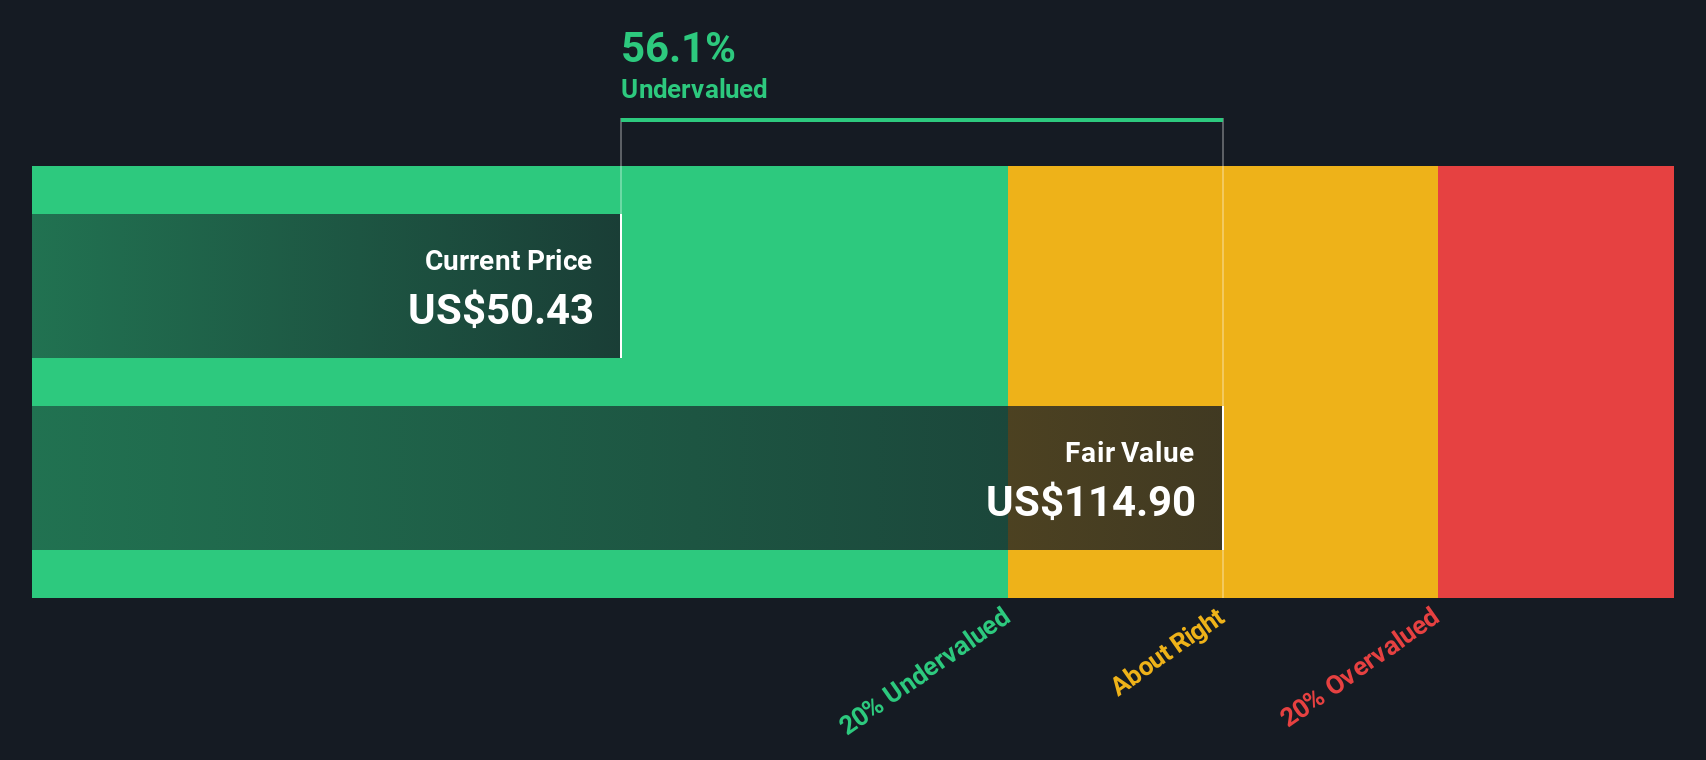
Another view, using future cash flows
While the 11.8x P/E paints MPLX as cheap, our DCF model takes a different angle and values the units at US$127.09 based on future cash flows, versus the current US$55.62 price. That signals a much wider gap. Is the market missing something? Or are the cash flow assumptions too generous?
Simply Wall St performs a discounted cash flow (DCF) on every stock in the world every day (check out MPLX for example). We show the entire calculation in full. You can track the result in your watchlist or portfolio and be alerted when this changes, or use our stock screener to discover 881 undervalued stocks based on their cash flows. If you save a screener we even alert you when new companies match - so you never miss a potential opportunity.
Build Your Own MPLX Narrative
If you see the numbers differently or prefer to test your own assumptions, you can build a personalised MPLX view in just a few minutes with Do it your way.
A great starting point for your MPLX research is our analysis highlighting 4 key rewards and 2 important warning signs that could impact your investment decision.
Looking for more investment ideas?
If MPLX has your attention, do not stop there. A few minutes with the Simply Wall St screener can quickly surface other opportunities that fit your style.
- Spot potential value candidates early by checking out these 881 undervalued stocks based on cash flows that might be trading below what their cash flows suggest.
- Ride the next wave of automation and data by scanning these 23 AI penny stocks for companies tied to artificial intelligence themes.
- Add diversification with income potential by reviewing these 13 dividend stocks with yields > 3% that offer yields above 3%.
This article by Simply Wall St is general in nature. We provide commentary based on historical data and analyst forecasts only using an unbiased methodology and our articles are not intended to be financial advice. It does not constitute a recommendation to buy or sell any stock, and does not take account of your objectives, or your financial situation. We aim to bring you long-term focused analysis driven by fundamental data. Note that our analysis may not factor in the latest price-sensitive company announcements or qualitative material. Simply Wall St has no position in any stocks mentioned.