Assessing New York Times (NYT) Valuation After Strong Earnings And Growing Digital Subscriptions
New York Times Company Class A NYT | 85.69 | +0.35% |
New York Times (NYT) is back in focus after reporting its fourth quarter and full year 2025 results, with higher revenue and net income year on year and continued growth in digital subscribers.
At a share price of $72.21, New York Times has had a 25.34% 90 day share price return and a 30.85% 1 year total shareholder return. This suggests recent momentum has built on longer term gains as investors weigh earnings and its push into new digital offerings.
If NYT's media shift has caught your attention, this could be a good moment to widen the lens and look at fast growing stocks with high insider ownership as potential next ideas.
With NYT trading above the average analyst price target but still flagged by some models as trading at a discount to intrinsic value, is the recent surge merely catching up to fundamentals, or is the market already pricing in future growth?
Most Popular Narrative: 8% Overvalued
New York Times last closed at $72.21, while the most followed narrative suggests a fair value of about $66.88 using a 6.96% discount rate.
Robust growth in digital subscriptions driven by an expanding portfolio of bundled offerings (news, Cooking, Games, The Athletic) and a focus on direct consumer relationships positions the company to capture more recurring revenue, strengthen ARPU, and reduce churn, this directly supports long term revenue and margin expansion.
Curious what kind of subscriber gains, pricing power, and margin shifts are baked into that number, and how long they are projected to last? The full narrative sets out a detailed earnings path, revenue mix shift, and future P/E assumption that together explain why fair value lands below today’s share price.
Result: Fair Value of $66.88 (OVERVALUED)
However, there are still real pressure points here, including potential traffic loss if AI overviews reduce referrals and the risk that heavy promo pricing makes long term ARPU growth harder.
Another View: Cash Flows Point the Other Way
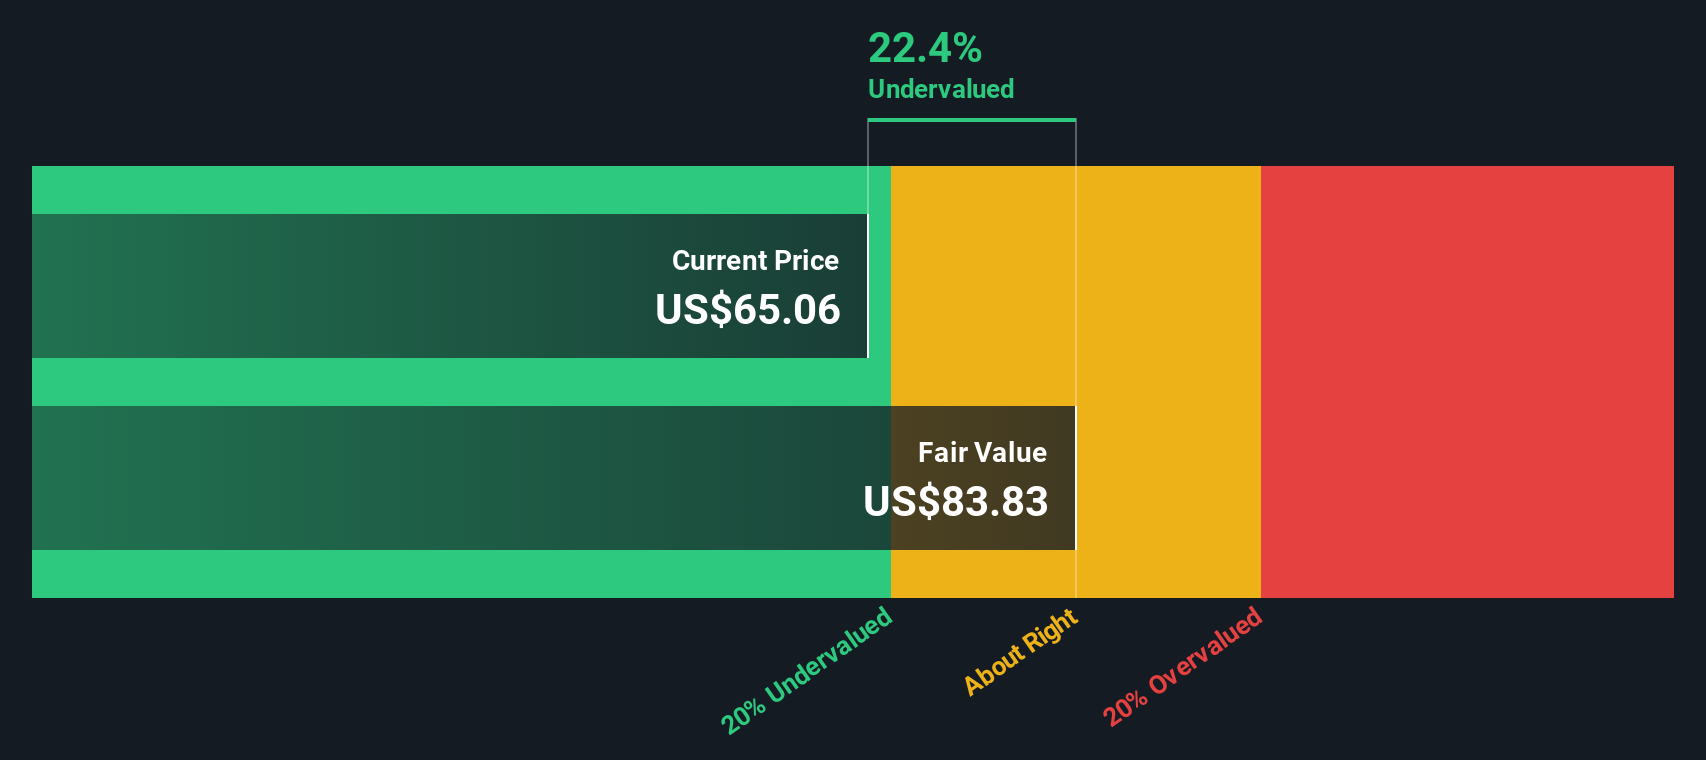
While the most popular narrative pegs New York Times at around $66.88 and labels the stock as about 8% overvalued, our DCF model points in the opposite direction, with an estimated future cash flow value of $83.83 per share, or about 13.9% above the current $72.21 price.
That gap suggests the DCF view sees more value in NYT's long term cash generation than the earnings based narrative. The earnings based view leans on a lower fair value and a richer P/E of 34.7x versus a fair ratio of 22.3x. As an investor, which story do you trust more, the earnings path or the cash flows?
Simply Wall St performs a discounted cash flow (DCF) on every stock in the world every day (check out New York Times for example). We show the entire calculation in full. You can track the result in your watchlist or portfolio and be alerted when this changes, or use our stock screener to discover 867 undervalued stocks based on their cash flows. If you save a screener we even alert you when new companies match - so you never miss a potential opportunity.
Build Your Own New York Times Narrative
If you see the story playing out differently, or just like to stress test the numbers yourself, you can build a custom thesis in minutes using Do it your way.
A great starting point for your New York Times research is our analysis highlighting 3 key rewards and 1 important warning sign that could impact your investment decision.
Looking for more investment ideas?
If NYT has sharpened your thinking, do not stop there. Use the Simply Wall St Screener to quickly surface other focused ideas that fit your style.
- Spot early stage potential by checking out these 3532 penny stocks with strong financials that pair smaller market caps with stronger financial profiles than you might expect.
- Explore the AI trend more deliberately by scanning these 25 AI penny stocks for companies tied directly to machine learning, data infrastructure, and automation themes.
- Focus on price versus fundamentals with these 867 undervalued stocks based on cash flows to see which companies screens flag as underpriced based on projected cash flows.
This article by Simply Wall St is general in nature. We provide commentary based on historical data and analyst forecasts only using an unbiased methodology and our articles are not intended to be financial advice. It does not constitute a recommendation to buy or sell any stock, and does not take account of your objectives, or your financial situation. We aim to bring you long-term focused analysis driven by fundamental data. Note that our analysis may not factor in the latest price-sensitive company announcements or qualitative material. Simply Wall St has no position in any stocks mentioned.