Assessing Nutanix (NTNX) Valuation As Analyst Downgrades Meet Earnings Uncertainty
Nutanix NTNX | 38.26 38.89 | 0.00% +1.65% Pre |
Recent analyst moves around Nutanix (NTNX), including reduced targets and a Zacks Rank of #4 (Sell), have sharpened attention on the stock ahead of an earnings report that is expected to show EPS pressure alongside revenue growth.
That backdrop of cautious analyst sentiment and Nutanix’s partnerships, such as Ark Data Centers earning top-tier partner status, comes after a sharp reset in the share price, with a 30 day share price return of 18.82% and a 1 year total shareholder return of 40.74%. However, a 3 year total shareholder return of 47.20% and 5 year total shareholder return of 23.95% suggest the longer term story has been more resilient even as recent momentum has faded.
If this earnings uncertainty has you reassessing the sector, it could be a good moment to scan a wider set of enterprise and cloud names through our 57 profitable AI stocks that aren't just burning cash.
With Nutanix trading at $41.76 against an average analyst target of $63.74 and an indicated intrinsic value gap of about 45%, you have to ask yourself: is this reset a genuine opportunity, or is the market already pricing in future growth?
Most Popular Narrative: 36.7% Undervalued
With Nutanix’s fair value in the most followed narrative set at $66.00 against a last close of $41.76, the gap is hard to ignore and raises clear questions about what kind of growth and profitability profile that figure is built on.
Ongoing enterprise digital transformation and demand for scalable solutions, as evidenced by large multi-year deals, major wins like Finanz Informatik, and increasing contributions from Global 2000 customers, provide a robust pipeline for future "land and expand" motions, improving both revenue visibility and opportunities for net new ARR expansion.
Want to see what is baked into that $66.00 fair value? The narrative leans on double digit revenue growth, rising margins, and a richer earnings multiple. Curious which assumptions really move the valuation and how sensitive that story is to execution and contract trends?
Result: Fair Value of $66.00 (UNDERVALUED)
However, this story can break if hyperscale clouds keep pulling workloads away or if operating costs remain high enough to limit the margin upside that analysts are modeling.
Another View: Earnings Multiple Sends A Different Signal
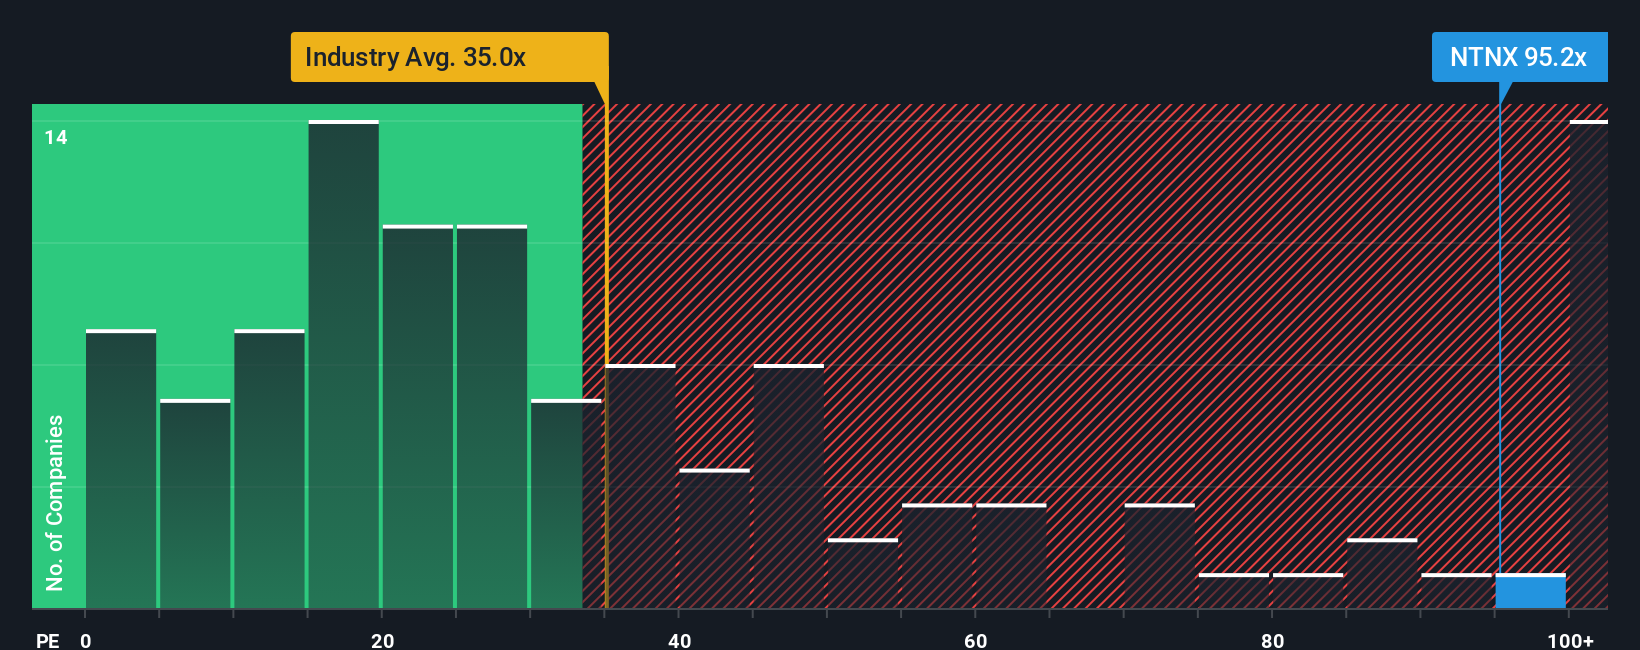
While our model-based fair value suggests Nutanix is trading below estimated cash flow value, the current P/E of 51.2x tells a more cautious story. It is cheaper than peer averages at 61.8x, yet far richer than the US Software industry at 26.7x and above a fair ratio of 42x. That gap points to real valuation risk if sentiment cools, so how comfortable are you paying this kind of premium?
Build Your Own Nutanix Narrative
If you see the numbers differently or prefer to test your own assumptions, you can build a full Nutanix story yourself in just a few minutes by starting with Do it your way.
A great starting point for your Nutanix research is our analysis highlighting 3 key rewards and 2 important warning signs that could impact your investment decision.
Ready for more investment ideas?
If Nutanix has sharpened your thinking, do not stop here. Broaden your watchlist with other focused ideas that could sharpen your next move.
- Target quality at a discount by scanning our 54 high quality undervalued stocks, which surfaces companies with strong fundamentals priced below their estimated worth.
- Prioritise resilience and sleep easier at night by reviewing the 85 resilient stocks with low risk scores, built to highlight businesses with lower overall risk profiles.
- Hunt for future leaders before the crowd by checking our screener containing 23 high quality undiscovered gems, which focuses on underfollowed companies with solid financials.
This article by Simply Wall St is general in nature. We provide commentary based on historical data and analyst forecasts only using an unbiased methodology and our articles are not intended to be financial advice. It does not constitute a recommendation to buy or sell any stock, and does not take account of your objectives, or your financial situation. We aim to bring you long-term focused analysis driven by fundamental data. Note that our analysis may not factor in the latest price-sensitive company announcements or qualitative material. Simply Wall St has no position in any stocks mentioned.