Assessing NXP Semiconductors (NXPI) Valuation After New Automotive And Edge AI Launches And Partnerships
NXP Semiconductors NV NXPI | 0.00 |
NXP Semiconductors (NXPI) recently outlined a series of product launches and partnerships in automotive, edge AI, and healthcare, giving investors fresh context for evaluating the stock’s role in these end markets.
The recent flurry of edge AI and automotive announcements comes as NXP’s share price trades at $241.15, with an 11.59% 90 day share price return and an 18.78% 1 year total shareholder return. This suggests momentum has been building rather than fading.
If you are following how AI is spreading from cars to factories and smart devices, this is a good moment to look beyond a single name and check out high growth tech and AI stocks.
With NXP’s shares at $241.15 and a 1 year total return of 18.78%, plus active moves in automotive and edge AI, the real question is whether you are seeing an overlooked opportunity or a price that already reflects future growth.
Most Popular Narrative: 6.6% Undervalued
Using a 10.09% discount rate, the most followed narrative points to a fair value of about US$258 per share versus NXP’s last close of US$241.15. This sets up a valuation gap that hinges on how its growth and margins develop.
The analysts have a consensus price target of $258.19 for NXP Semiconductors based on their expectations of its future earnings growth, profit margins and other risk factors. However, there is a degree of disagreement amongst analysts, with the most bullish reporting a price target of $289.0, and the most bearish reporting a price target of just $210.0.
Want to see what sits behind that valuation gap? The narrative leans on higher earnings, wider margins and a future profit multiple that depends on those forecasts being realized.
Result: Fair Value of $258.19 (UNDERVALUED)
However, there are clear pressure points, including modest end-demand recovery and intense competition from China, that could challenge the earnings, margin, and P/E assumptions behind this narrative.
Another View: Our DCF Model Flags Caution
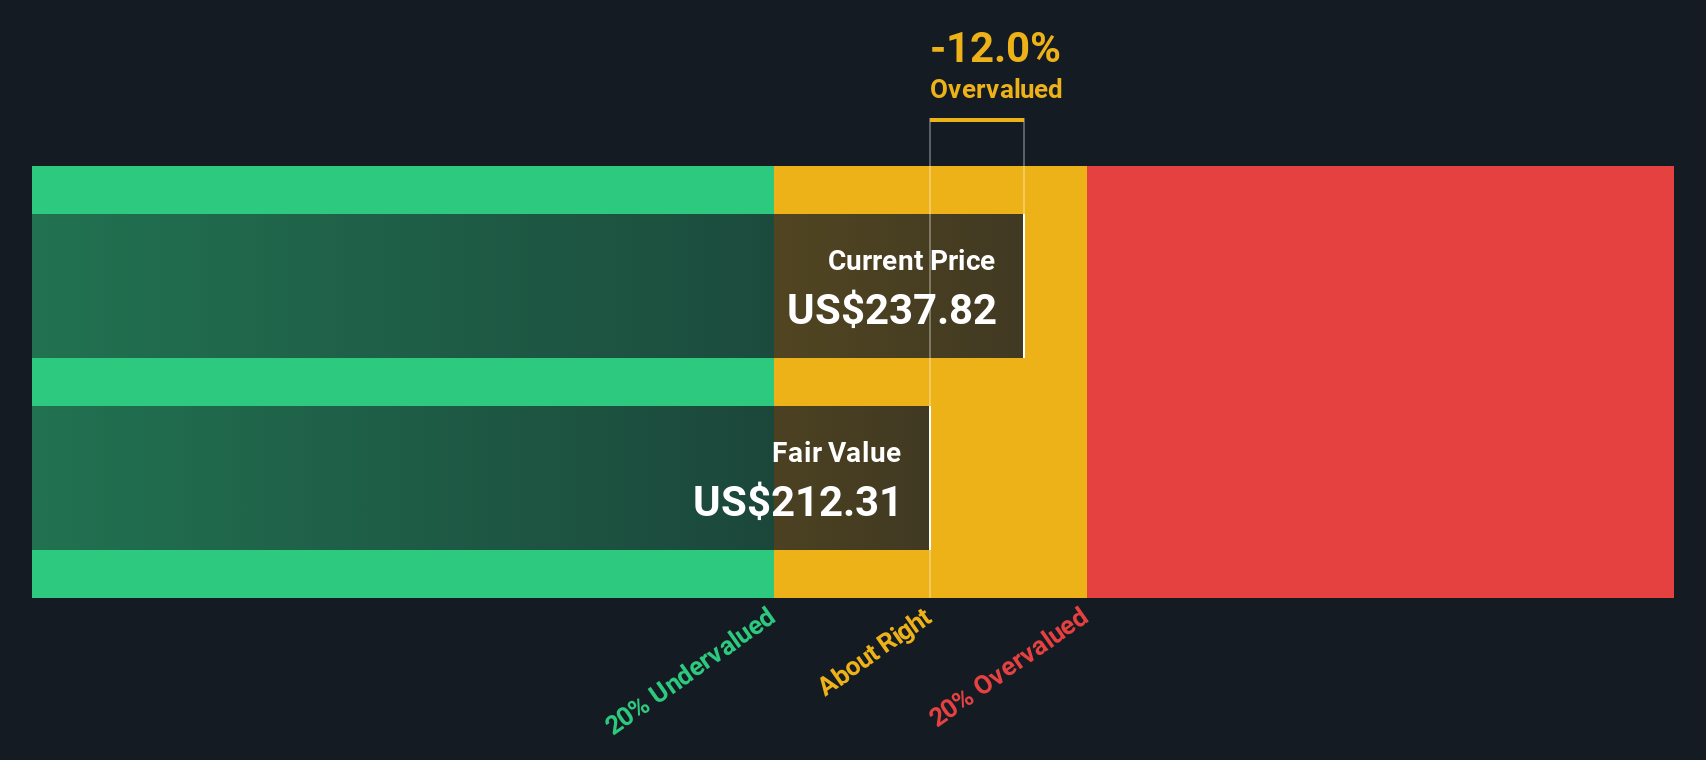
While the analyst narrative points to a 6.6% undervaluation, the SWS DCF model paints a different picture. On that framework, NXP Semiconductors, at US$241.15, screens as overvalued versus an estimated fair value of US$205.52. Instead of a cushion, this implies a valuation premium you need to be comfortable with.
With one approach suggesting room to run and another implying the price is already ahead of itself, which set of assumptions about growth, margins and risk feels closer to your own view?
Simply Wall St performs a discounted cash flow (DCF) on every stock in the world every day (check out NXP Semiconductors for example). We show the entire calculation in full. You can track the result in your watchlist or portfolio and be alerted when this changes, or use our stock screener to discover 885 undervalued stocks based on their cash flows. If you save a screener we even alert you when new companies match - so you never miss a potential opportunity.
Build Your Own NXP Semiconductors Narrative
If you look at the numbers and reach a different conclusion, or simply prefer to work from your own assumptions, you can build a custom view in just a few minutes, starting with Do it your way.
A great starting point for your NXP Semiconductors research is our analysis highlighting 3 key rewards and 2 important warning signs that could impact your investment decision.
Looking for more investment ideas?
If NXP has sharpened your thinking, do not stop there. Use the Simply Wall St screener to spot other opportunities that could fit your portfolio.
- Target potential deep value by checking out these 885 undervalued stocks based on cash flows that might be trading below what their cash flows suggest.
- Consider the next wave of automation by scanning these 26 AI penny stocks shaping everything from data centers to real world applications.
- Look beyond the headlines in digital assets with these 79 cryptocurrency and blockchain stocks tied to blockchain infrastructure, exchanges, and related services.
This article by Simply Wall St is general in nature. We provide commentary based on historical data and analyst forecasts only using an unbiased methodology and our articles are not intended to be financial advice. It does not constitute a recommendation to buy or sell any stock, and does not take account of your objectives, or your financial situation. We aim to bring you long-term focused analysis driven by fundamental data. Note that our analysis may not factor in the latest price-sensitive company announcements or qualitative material. Simply Wall St has no position in any stocks mentioned.