Assessing Olema Pharmaceuticals (OLMA) Valuation After A Year Of Strong Returns And Recent Share Price Weakness
Olema Pharmaceuticals, Inc. OLMA | 0.00 |
Why Olema Pharmaceuticals Stock Is On Investors’ Radar
Olema Pharmaceuticals (OLMA) has drawn attention after a stretch of mixed returns, including a loss over the past 3 months and a gain over the past year, which is prompting fresh questions about how investors view its clinical pipeline.
At a share price of $14.64, Olema’s recent 3 month share price decline of 44.42% contrasts with a very large 218.26% 1 year total shareholder return. This suggests earlier enthusiasm has cooled as investors reassess clinical and execution risks.
If Olema’s recent swing has you reassessing risk and reward in high growth healthcare, it can be useful to compare it with other specialist biotech opportunities that also use artificial intelligence in drug development via the 35 healthcare AI stocks
With Olema trading at $14.64 and an implied gap to a US$43.00 analyst target alongside an intrinsic value estimate suggesting a discount, it is reasonable to ask whether there is a buying opportunity here or whether future growth is already priced in.
Preferred Price to Book Multiple of 2.7x: Is It Justified?
Olema Pharmaceuticals last closed at $14.64, and on a P/B of 2.7x, the stock screens as expensive versus the broader US Biotechs industry average of 2.3x.
P/B compares the company’s market value with its accounting book value, which is a common way to look at early stage or loss making biotechs where earnings are not yet meaningful. For Olema, this ratio sits against a backdrop of minimal current revenue, a reported net loss of $162.451 million, and forecasts that point to the company remaining unprofitable over the next 3 years.
Where it gets more nuanced is peer comparison. While Olema trades above the wider Biotechs industry average on a P/B basis, it is described as good value relative to a much higher peer group average P/B of 14.9x. That contrast suggests the broader peer set is priced on expectations that are more aggressive, while Olema’s valuation sits closer to the lower end of that range despite similarly early stage financials.
Result: Price-to-book of 2.7x (ABOUT RIGHT)
However, the story could change quickly if clinical trial results disappoint or if continued net losses of $162.451 million pressure Olema’s US$1.3b market value.
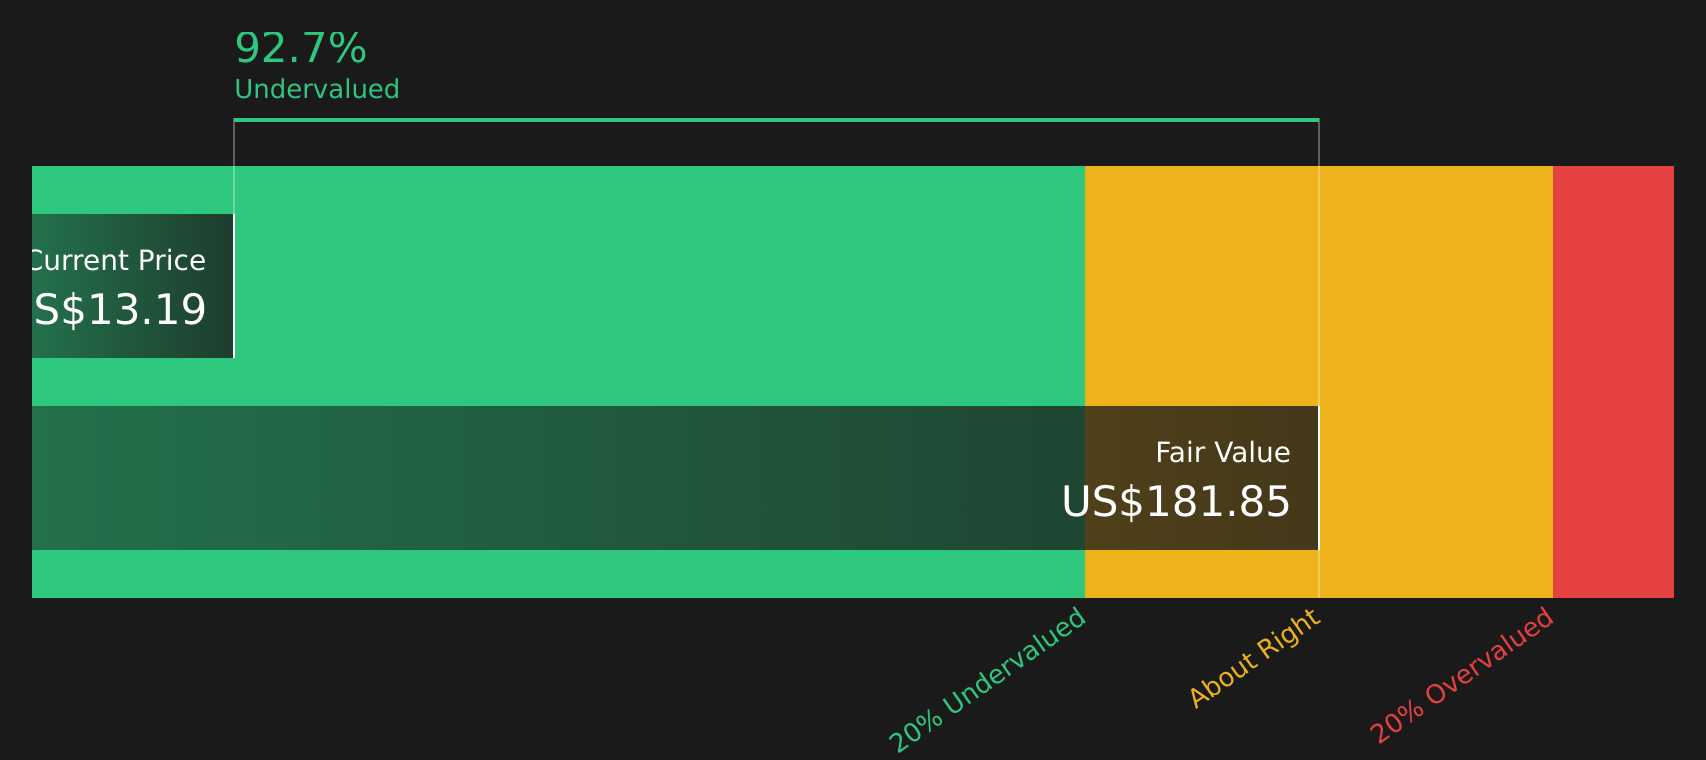
DCF Suggests A Very Different Story
While the 2.7x P/B ratio makes Olema look a bit expensive compared with the broader US Biotechs average of 2.3x, our DCF model points in the opposite direction. At $14.64, the stock is trading at a 93% discount to an estimated future cash flow value of $210.21.
This kind of gap between a balance sheet based metric and a cash flow based estimate raises a straightforward question for investors: is the market overstating clinical and funding risks, or is the DCF too optimistic about how much future cash flow Olema can deliver?
Simply Wall St performs a discounted cash flow (DCF) on every stock in the world every day (check out Olema Pharmaceuticals for example). We show the entire calculation in full. You can track the result in your watchlist or portfolio and be alerted when this changes, or use our stock screener to discover 51 high quality undervalued stocks. If you save a screener we even alert you when new companies match - so you never miss a potential opportunity.
Next Steps
This article presents mixed signals that may leave you cautious yet curious, so consider acting soon by weighing both sides of the story with the 2 key rewards and 3 important warning signs
Looking for more investment ideas?
If Olema has caught your attention, do not stop here. Broaden your watchlist now so you are not relying on a single story to shape your next move.
- Target potential mispricings by scanning 51 high quality undervalued stocks that combine quality fundamentals with prices that may not fully reflect them.
- Strengthen your income focus by reviewing 13 dividend fortresses that offer higher yields while aiming to keep payouts supported.
- Prioritise resilience by checking 72 resilient stocks with low risk scores that score well on financial stability and lower overall risk.
This article by Simply Wall St is general in nature. We provide commentary based on historical data and analyst forecasts only using an unbiased methodology and our articles are not intended to be financial advice. It does not constitute a recommendation to buy or sell any stock, and does not take account of your objectives, or your financial situation. We aim to bring you long-term focused analysis driven by fundamental data. Note that our analysis may not factor in the latest price-sensitive company announcements or qualitative material. Simply Wall St has no position in any stocks mentioned.