Assessing Park National (PRK) Valuation After Recent Share Price Momentum And Mixed Return Signals
Park National Corporation PRK | 164.63 | +0.91% |
What Park National’s Recent Performance Signals for Investors
Park National (PRK) has been drawing fresh attention after a steady run in recent months, with the share price last closing at US$174.61 and the stock showing mixed short term return figures.
Over the past week, Park National’s return was about a 1% decline, while the past month shows roughly 8% and the past 3 months about 16%. Year to date, the total return stands near 13%, with around 7% over the past year and multi year total returns that sit well above that level.
At the same time, the bank reports annual revenue of US$545.704m and net income of US$180.073m, paired with a value score of 2. These figures provide a snapshot of both scale and profitability for investors assessing whether the recent share performance is consistent with the underlying business.
Recent trading suggests momentum is building, with a 1 day share price return of 1.01% and a 30 day share price return of 7.98%. The 5 year total shareholder return of 66.04% points to solid longer term compounding.
If Park National’s move has caught your eye and you want to broaden your watchlist, now could be a good time to check out 23 top founder-led companies.
With PRK trading near US$174.61, an implied intrinsic discount of about 30% and only a small gap to the analyst price target, the key question is whether you are looking at real value or a market that is already pricing in future growth.
Preferred P/E of 17.5x: Is it justified?
On a P/E of 17.5x, Park National trades at a richer earnings multiple than many US banks, even though the shares also show a sizeable discount to one DCF estimate.
The P/E ratio compares the current share price to earnings per share and is a common way to gauge how much you are paying for each dollar of earnings, especially for a profitable bank like Park National.
Here, the current P/E of 17.5x sits above both the US Banks industry average of 11.9x and the peer group average of 15.7x. It also exceeds an estimated fair P/E of 12.7x that our analysis suggests the market could move towards if sentiment were to cool.
Against the industry average, Park National’s 17.5x P/E stands out as clearly more expensive. The market is currently assigning a premium relative to typical bank valuations and to the estimated fair ratio benchmark.
Result: Price-to-Earnings of 17.5x (OVERVALUED)
However, a premium P/E with only a 4% gap to the US$181.50 analyst target could limit upside if sentiment cools or if earnings expectations shift.
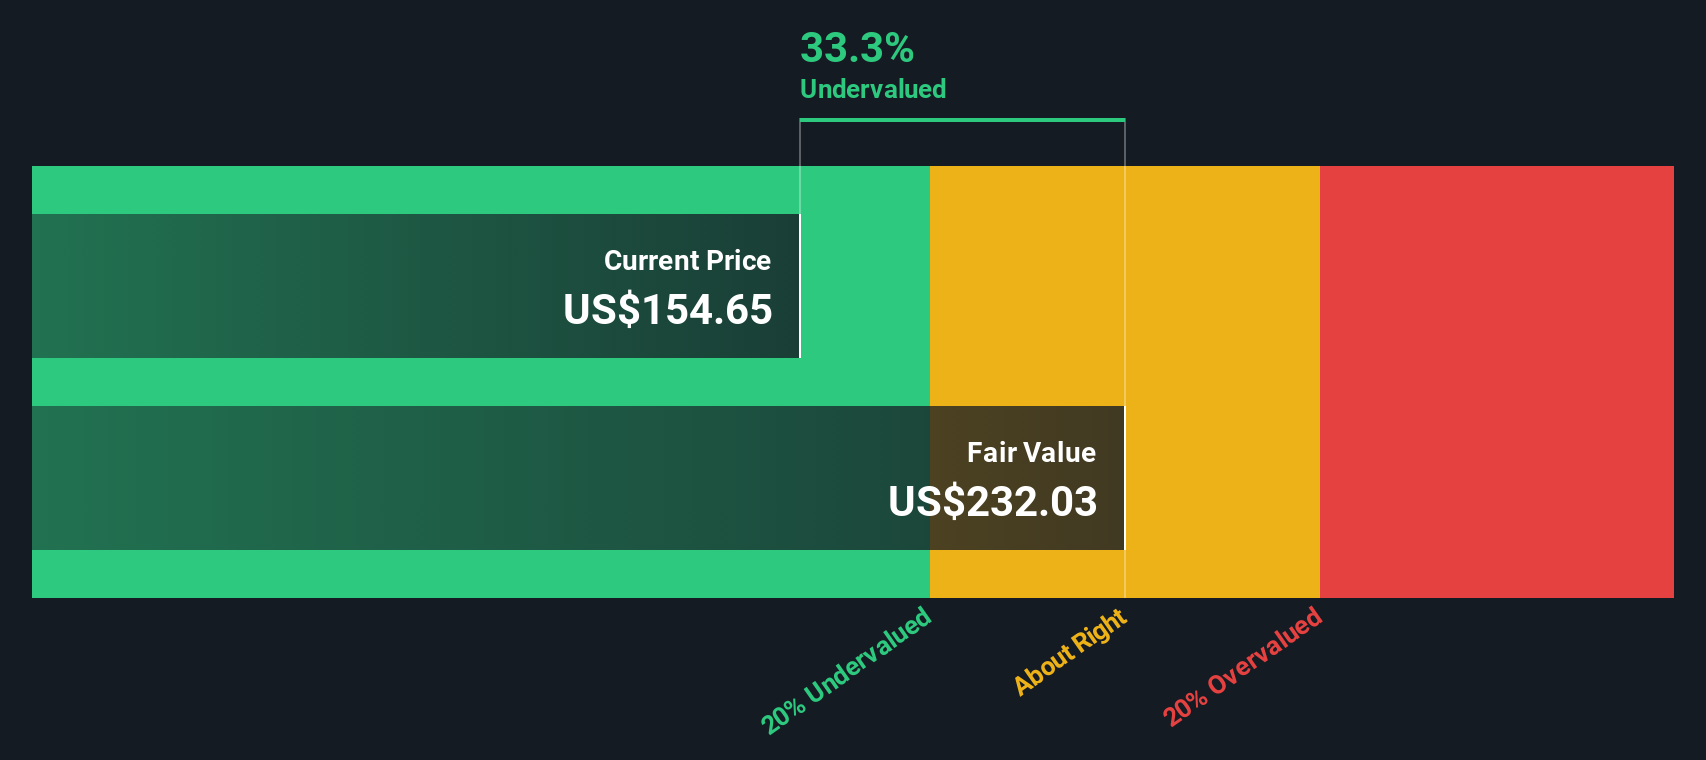
Another View: DCF Suggests a Different Story
While the 17.5x P/E makes Park National look expensive, our DCF model points in a different direction. With the shares at $174.61 and a future cash flow value estimate of $248.81, the model indicates roughly a 30% gap. Is this a genuine mispricing or simply the result of optimistic assumptions?
Simply Wall St performs a discounted cash flow (DCF) on every stock in the world every day (check out Park National for example). We show the entire calculation in full. You can track the result in your watchlist or portfolio and be alerted when this changes, or use our stock screener to discover 54 high quality undervalued stocks. If you save a screener we even alert you when new companies match - so you never miss a potential opportunity.
Build Your Own Park National Narrative
If this take on Park National does not quite match your view, you can review the numbers yourself and shape a custom thesis in just a few minutes, then Do it your way.
A good starting point is our analysis highlighting 4 key rewards investors are optimistic about regarding Park National.
Looking for more investment ideas?
If Park National feels interesting but you do not want to stop here, broaden your opportunity set now so you are not relying on a single idea.
- Target value first and see which businesses pass your quality filter with our 54 high quality undervalued stocks.
- Prioritise resilience by scanning companies that score well on balance sheet strength using the solid balance sheet and fundamentals stocks screener (44 results).
- Hunt for potential off the radar opportunities with the screener containing 24 high quality undiscovered gems that screen for strong fundamentals.
This article by Simply Wall St is general in nature. We provide commentary based on historical data and analyst forecasts only using an unbiased methodology and our articles are not intended to be financial advice. It does not constitute a recommendation to buy or sell any stock, and does not take account of your objectives, or your financial situation. We aim to bring you long-term focused analysis driven by fundamental data. Note that our analysis may not factor in the latest price-sensitive company announcements or qualitative material. Simply Wall St has no position in any stocks mentioned.