Assessing PDD Holdings (PDD) Valuation After Options Jitters And A Recent Share Price Slide
PINDUODUO INC. PDD | 0.00 |
Options jitters and a 10% slide put PDD in focus
PDD Holdings (PDD) shares recently fell 10.08% as options trading turned cautious ahead of the March 19 earnings report, with heavier put activity and bursts of call volume signaling disagreement about what comes next.
That options driven pullback comes after a tougher stretch, with the share price down 19.68% over 90 days and 9.75% year to date, while the 1 year total shareholder return is roughly flat and the 5 year total shareholder return remains weak. This suggests momentum has faded despite PDD's growing global footprint and shifting perceptions of risk around regulation and earnings.
If this kind of volatility has you looking beyond a single e commerce name, it could be worth scanning high growth tech and AI stocks to spot other growth driven stories in the sector.
With shares pulling back, a value score of 6, and the stock trading below some analyst targets, the real question is whether PDD is quietly undervalued here or if the market already reflects its future growth story.
Price-to-Earnings of 10.1x: Is it justified?
At a last close of US$104.46, PDD is on a P/E of 10.1x, which screens as inexpensive relative to peers and some fair value estimates in the data.
The P/E multiple compares the current share price to earnings per share and is a quick shorthand for how much investors are paying for today’s profits. For a profitable e commerce group like PDD Holdings, which reports high quality earnings and a Return on Equity of 26.1%, this ratio is a commonly watched yardstick.
Here, the story is not just that 10.1x is lower than the global multiline retail average of 19.9x and well under the peer average of 54.1x. It is also below an estimated fair P/E of 25.5x that some models suggest the market could move closer to if sentiment or growth expectations improve. That is a wide gap for investors to weigh against forecasts that call for earnings growth of 11.39% per year and revenue growth of 10.2% per year.
Result: Price-to-Earnings of 10.1x (UNDERVALUED)
However, you still need to weigh risks such as regulatory shifts, tougher competition in e commerce, and any disappointment around revenue or net income growth trends.
Another View: What Our DCF Model Suggests
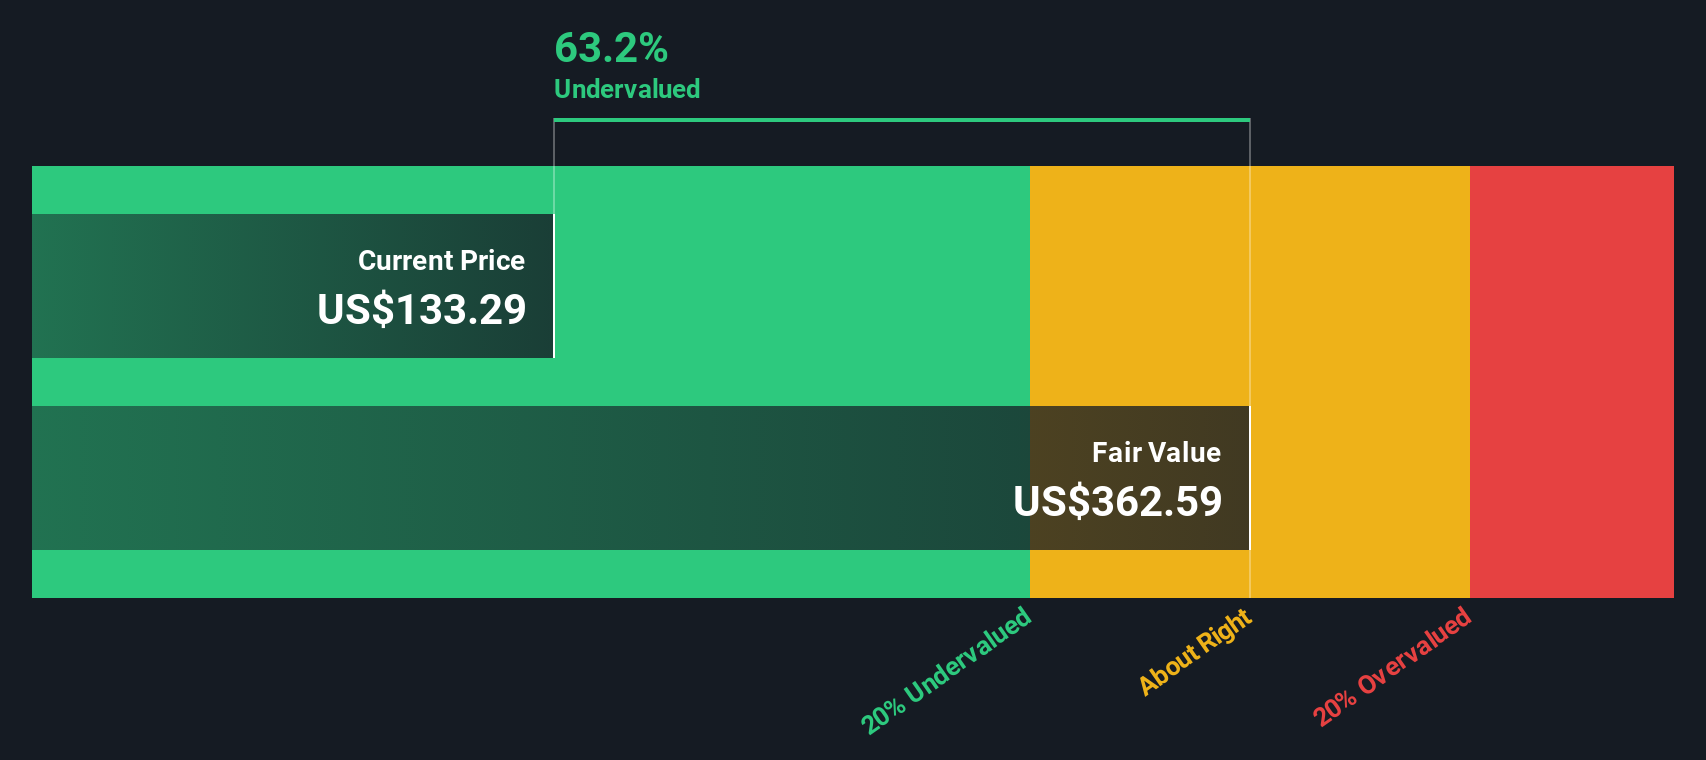
While the 10.1x P/E points to value, our DCF model paints an even starker picture, with an estimated future cash flow value of US$348.46 per share compared with the current US$104.46. That gap implies the market could be heavily discounting PDD's cash generation, or the model is too optimistic. Which one do you trust more, the market price or the spreadsheet?
Simply Wall St performs a discounted cash flow (DCF) on every stock in the world every day (check out PDD Holdings for example). We show the entire calculation in full. You can track the result in your watchlist or portfolio and be alerted when this changes, or use our stock screener to discover 872 undervalued stocks based on their cash flows. If you save a screener we even alert you when new companies match - so you never miss a potential opportunity.
Build Your Own PDD Holdings Narrative
If you see the numbers differently, or prefer to test your own assumptions against the data, you can build a custom view in minutes: Do it your way.
A good starting point is our analysis highlighting 4 key rewards investors are optimistic about regarding PDD Holdings.
Looking for more investment ideas?
If PDD has your attention, do not stop there, a few minutes with the right screeners could surface opportunities you will wish you spotted earlier.
- Spot potential turnaround stories by scanning these 3530 penny stocks with strong financials that pair smaller share prices with financial strength filters already applied for you.
- Zero in on future facing themes by reviewing these 23 AI penny stocks that tie artificial intelligence exposure to tighter fundamental checks.
- Target price dislocations by working through these 872 undervalued stocks based on cash flows where valuations are filtered using cash flow based metrics, not just simple multiples.
This article by Simply Wall St is general in nature. We provide commentary based on historical data and analyst forecasts only using an unbiased methodology and our articles are not intended to be financial advice. It does not constitute a recommendation to buy or sell any stock, and does not take account of your objectives, or your financial situation. We aim to bring you long-term focused analysis driven by fundamental data. Note that our analysis may not factor in the latest price-sensitive company announcements or qualitative material. Simply Wall St has no position in any stocks mentioned.